Task 6 - Day 2 - Snapshots, Alerts and Dashboards - Oh My!
As you have seen through this journey, the internet is the new network. Lets take a look at a few industry stats:
- 4 out of the top 5 Cloud Providers
- 10 out of the top 10 US Banks
- 10 out of the top 10 Global Software Companies
- 10 out of the top 10 Global Auto Manufacturers
What do all these organizations have in common? They trust their Digital User Experience to ThousandEyes.
Step 1: Create an Interactive Snapshot
The previous metric is an important one when we consider the use of ThousandEyes for our on organizations. We live in a world of find and escalate rather than find and fix. In today's network, its increasingly common to rely on networks and applications outside of our dominion, yet Network, Collaboration, End User, and App Teams still must provide the same level of access and assurance. Escalating with a trusted data set is critical in assuring that experience.
Investigate the Problem
-
You've been tasked to investigate the Critical Lab Application. You've recently learned that there have been reports of problems. Its your job to investigate the cause and escalate to the appropriate team.
-
In your Lab Account Group, navigate to Network & App Synthetics > Views and drop into the Critical Lab Application test view.
-
As you have done before, overlay multiple metrics using the drop down. Enabled Page Load, HTTP Server, Response Time, Loss and Latency. These five metrics will generally point you in the right direction.
-
What patterns start to emerge. Remember, you can set the primary metric to any of the displayed metrics to further investigate. What layer do you see the problem occurring at?
-
Once you have identified the layer of the problem, you now know what team to escalate to. The lowest layer you see the issue at is a good indicator of what team you need to escalate to.
-
After talking with the Application team, you understand this is a hosted application in your organizations AWS Private Cloud instance. You need to escalate the problem to Application team.
Create a Snapshot
Now that you have identified the issue lies in the Application Layer (HTTP Server metric), you need to escalate with the Application team.
-
As you have seen this far, everything in ThousandEyes is time context sensitive to where you highlight. Select a time when the failure is occurring.
-
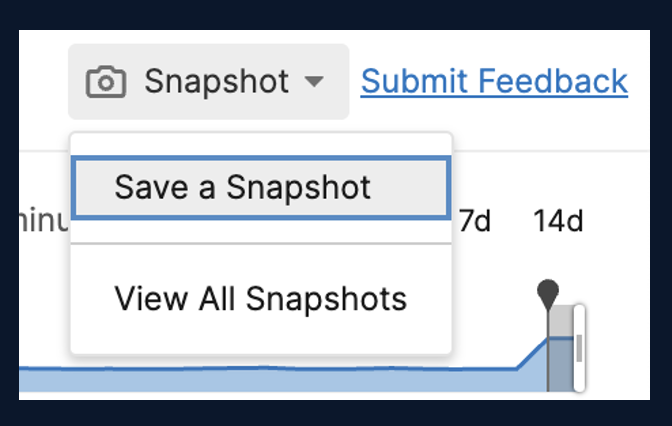
With the five layers still selected, create a snapshot by selecting Snapshot in the top right of the screen.
-
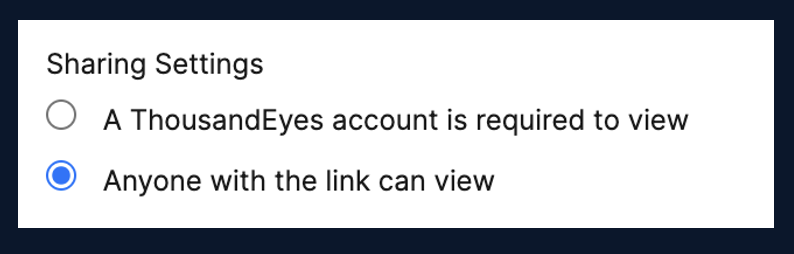
To share this publicly with read only credentials, be sure to select Anyone with the link can view.
-
If you were successful you should see a screen that looks like this.
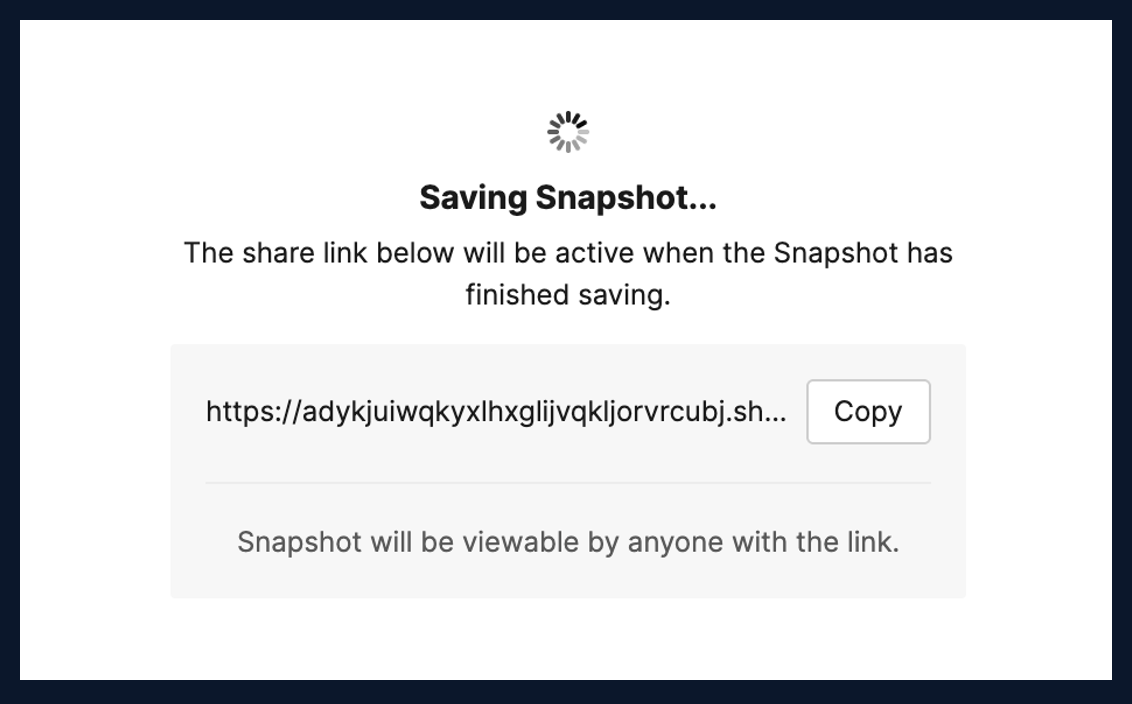
Go ahead and copy the link to the snapshot, it can take a minute to generate. Paste the link into a new screen to test the snapshot is working.
-
In a real world scenario, you would simply send this interactive data set to a specific team to escalate. In our 10+ years combined in a ThousandEyes seat, we have seen these leveraged internally developing a common operating language between business units within an organization as well as leveraged by business partners like SaaS vendors, ISPs, Cloud Providers and more!
-
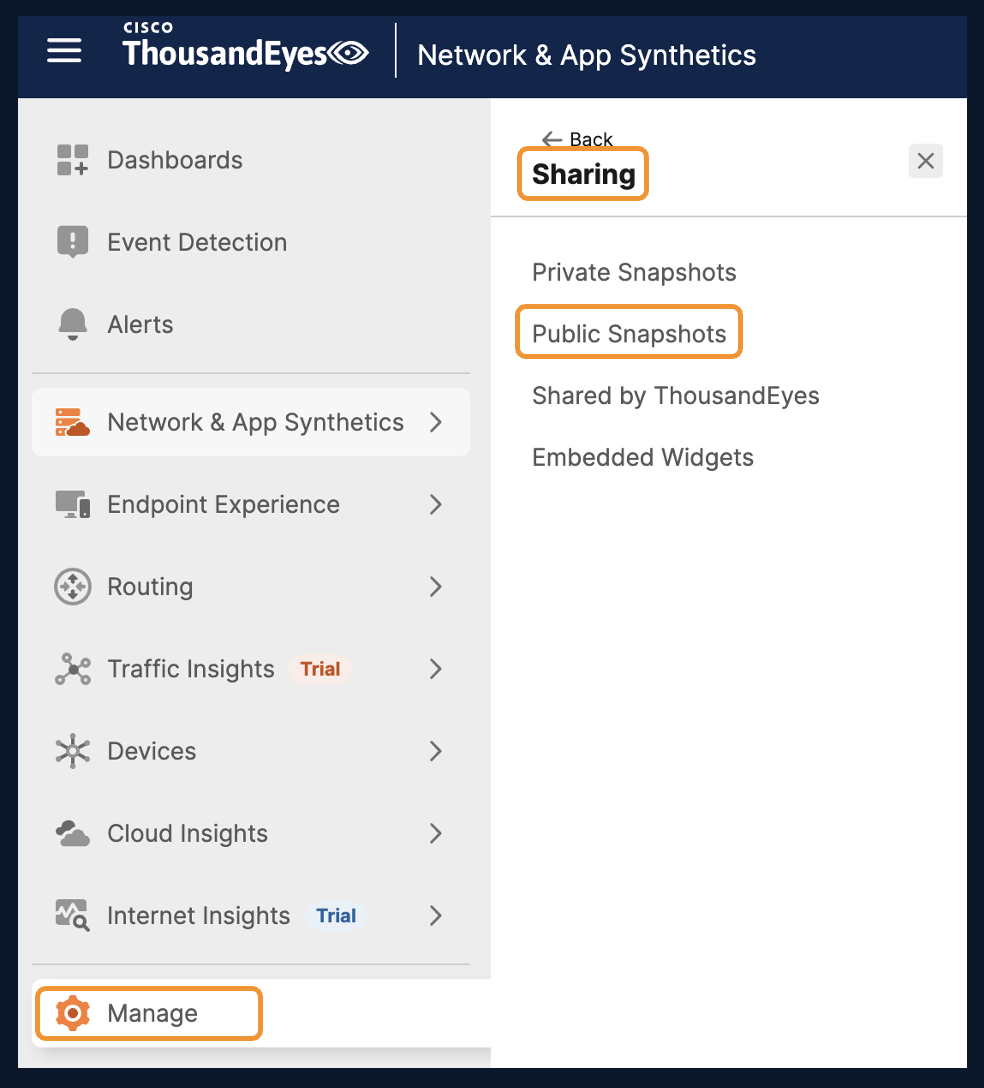
If you ever lose the link and need to send again, all Snapshots are stored in Manage > Sharing > Public Snapshots
-
Navigate there now.
-
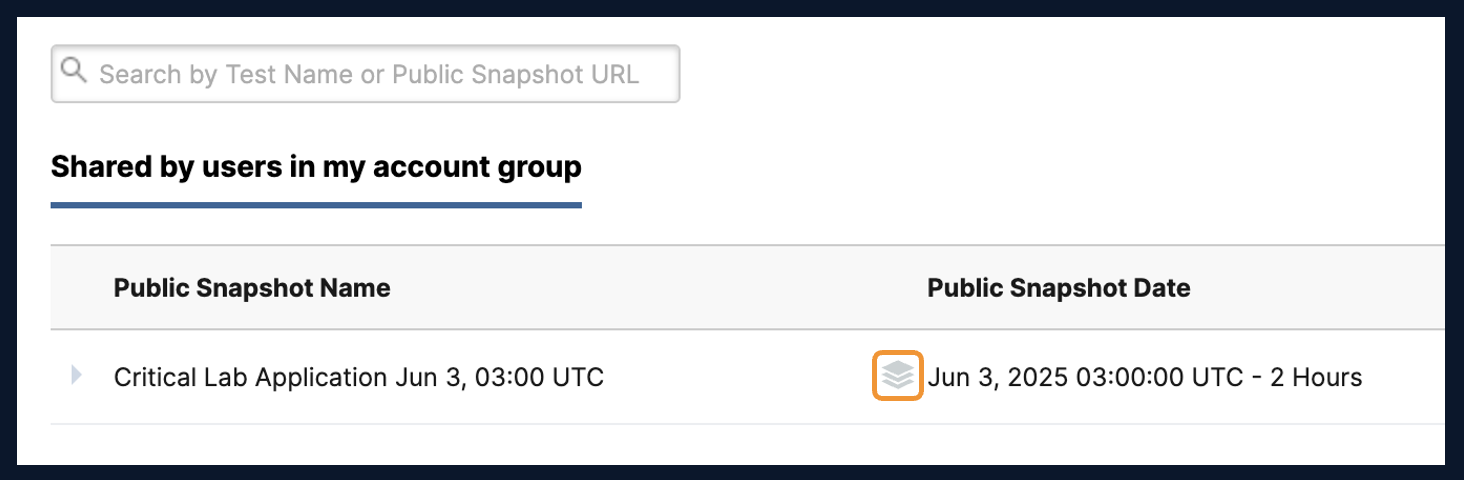
Select the Layers Icon to launch in the Publicly Shareable Snapshot.
Step 2: Create a Custom Alerts
You have seen in Task 3 that alerts were auto created with templates. When a custom test is created, the administrator need to create an Alert for that. The Teams testing you created before, go ahead and create voice related alerts for Loss, Latency, and Jitter.
Set Custom Alert Profile for Teams. Alerts are created under the Manage tab.
-
Navigate to Manage > Alerts Rules > Network & App Synthetics
-
Click Add New Alert Rule
- At 5% Loss - real time voice and video is negatively affected.
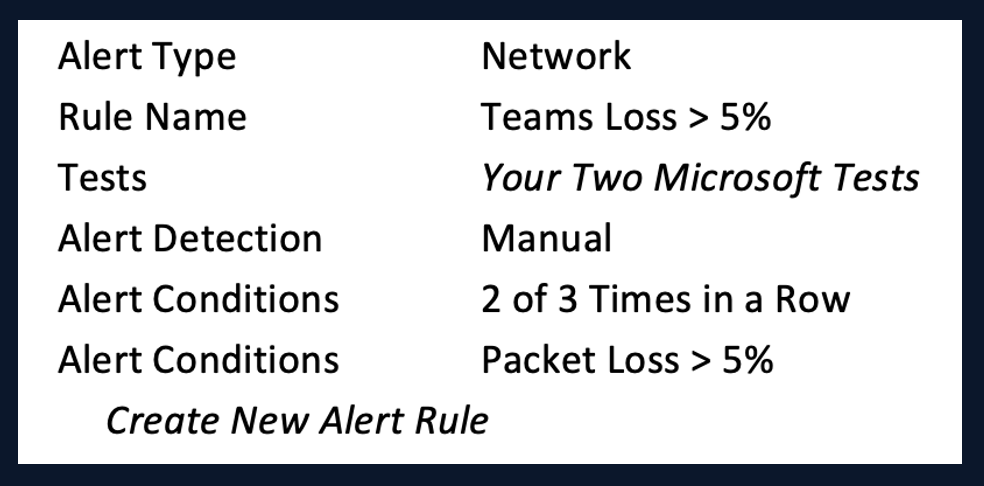
- Its widely recognized that at 150ms, real time voice and video is not consistent enough to carry on a conversation.
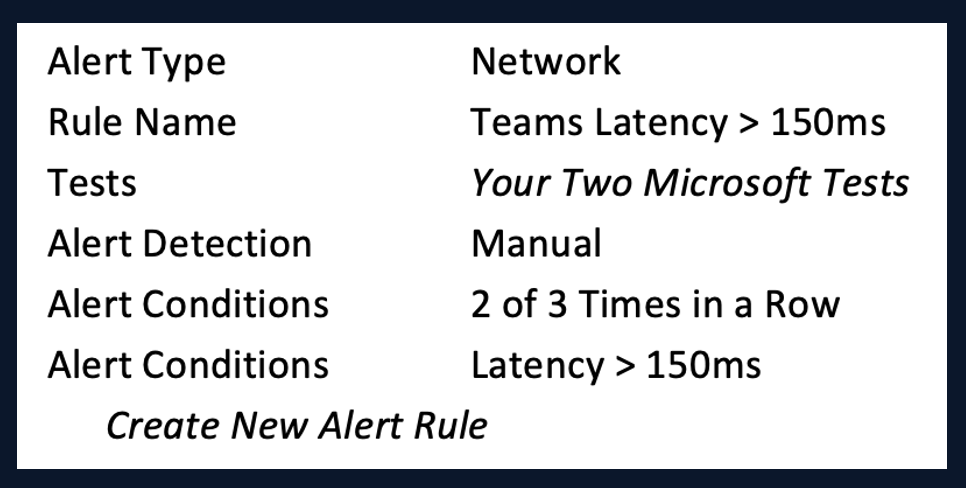
- Industry standard for Mean Opinion Scoring (MOS) is set with Packet Delay Variation (PDV), also known as Jitter. A PDV above above 30ms results in an very choppy real time voice and video experience.
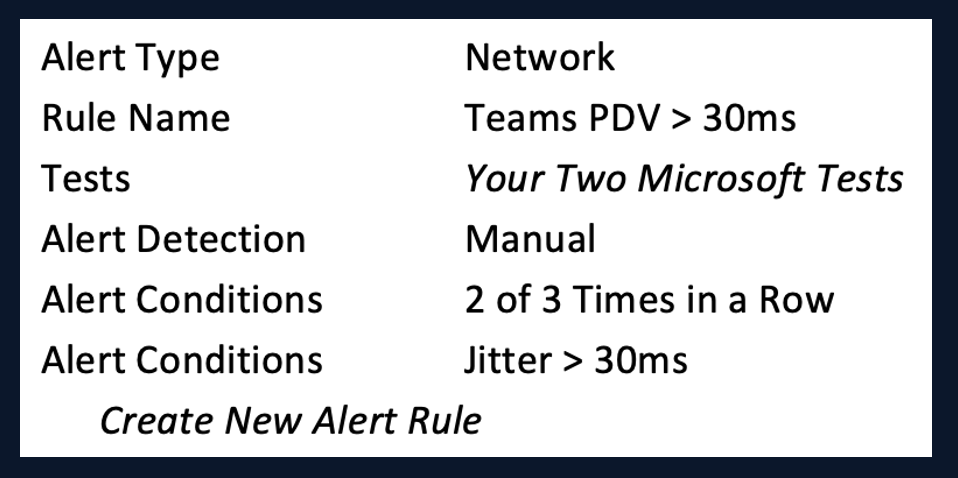
- If manual alerts seem complicated, there is good news. ThousandEyes recently launched Adaptive Alerts. You saw this in the previous step. Each metric in the system is given a baseline and ThousandEyes is able to determine when there are deviations from that well established baseline. For more information on Adaptive Alerts check out the page here - Adaptive Alerts
Step 3: Create a Custom Dashboard
Throughout this journey, you’ve taken a full tour of ThousandEyes, from initial deployment to deep-dive forensic investigations for determining root cause. For day-to-day operations, Alerts and Dashboards are essential. ThousandEyes is most effective when used proactively. Now, let’s take a look at dashboards and how they help visualize issues before they become problems.
Audit Dashboards
-
In your Lab Account Group navigate to Dashboards
-
You’ll notice several preconfigured “out-of-the-box” dashboards available. If you completed Task 3 correctly and deployed the Webex template, you should also see a dedicated Webex dashboard. When you create a test using a template, like the one for Webex in Task 3, an associated Availability Dashboard is automatically generated. This helps streamline management and reduces the operational overhead often seen with powerful platforms like ThousandEyes.
Custom Dashboards
Custom dashboards are key to fully understanding how ThousandEyes can be operationalized in a real environment. In Task 3, you created custom Teams testing. Unlike the Webex testing, no templated dashboards were created for this use case. Let’s build one now to visualize and monitor the Teams experience more effectively.
-
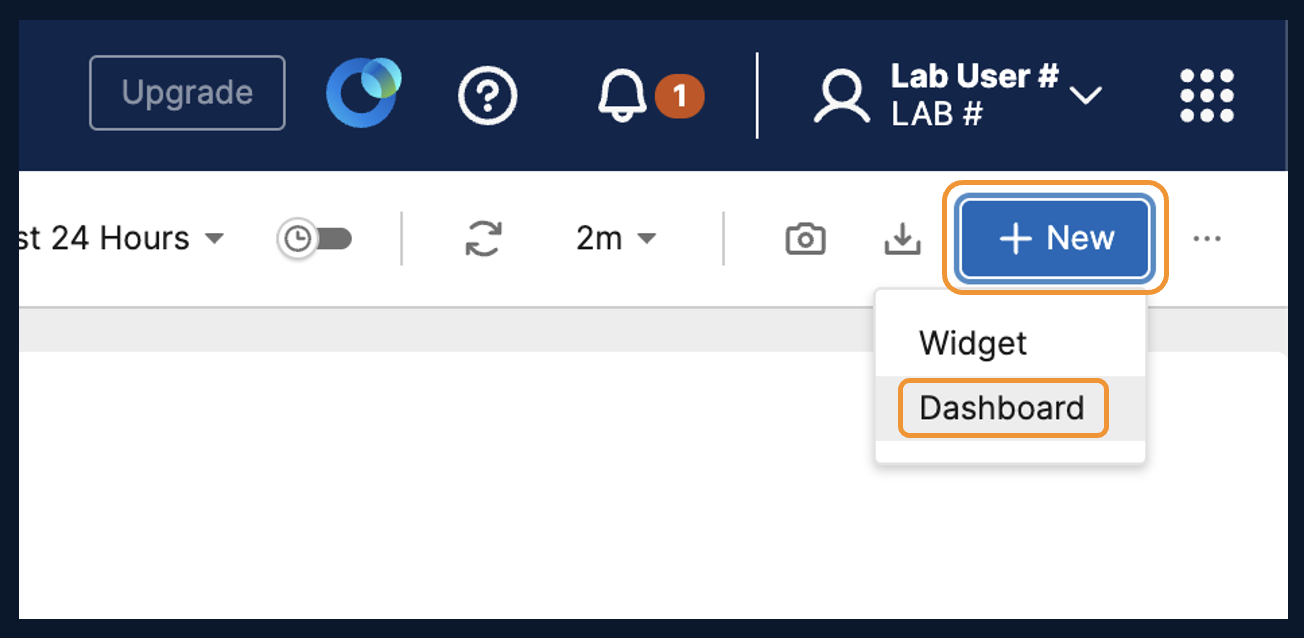
Create a new Dashboard by navigating to Dashboards in the main menu.
-
In the top right-hand corner click on + New > Dashboard
-
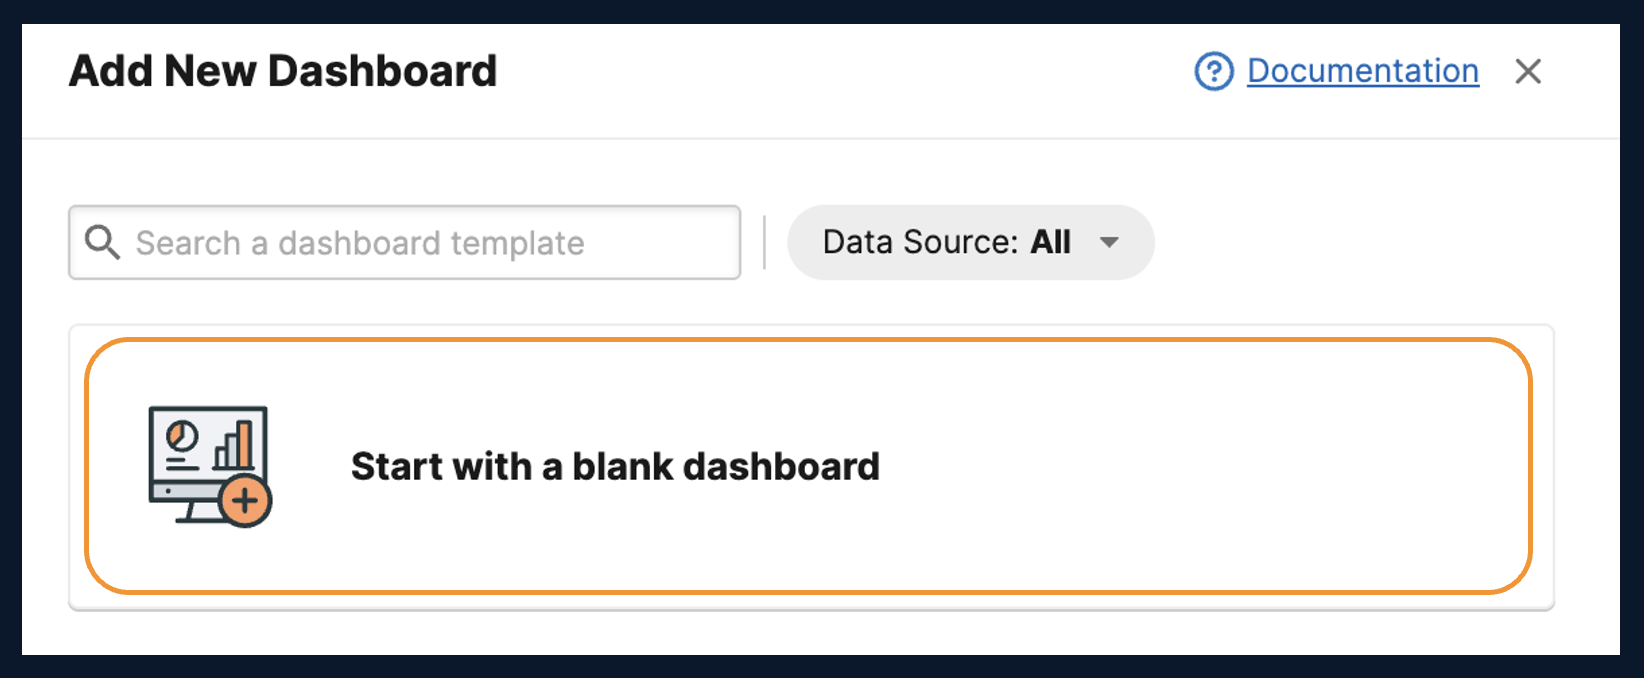
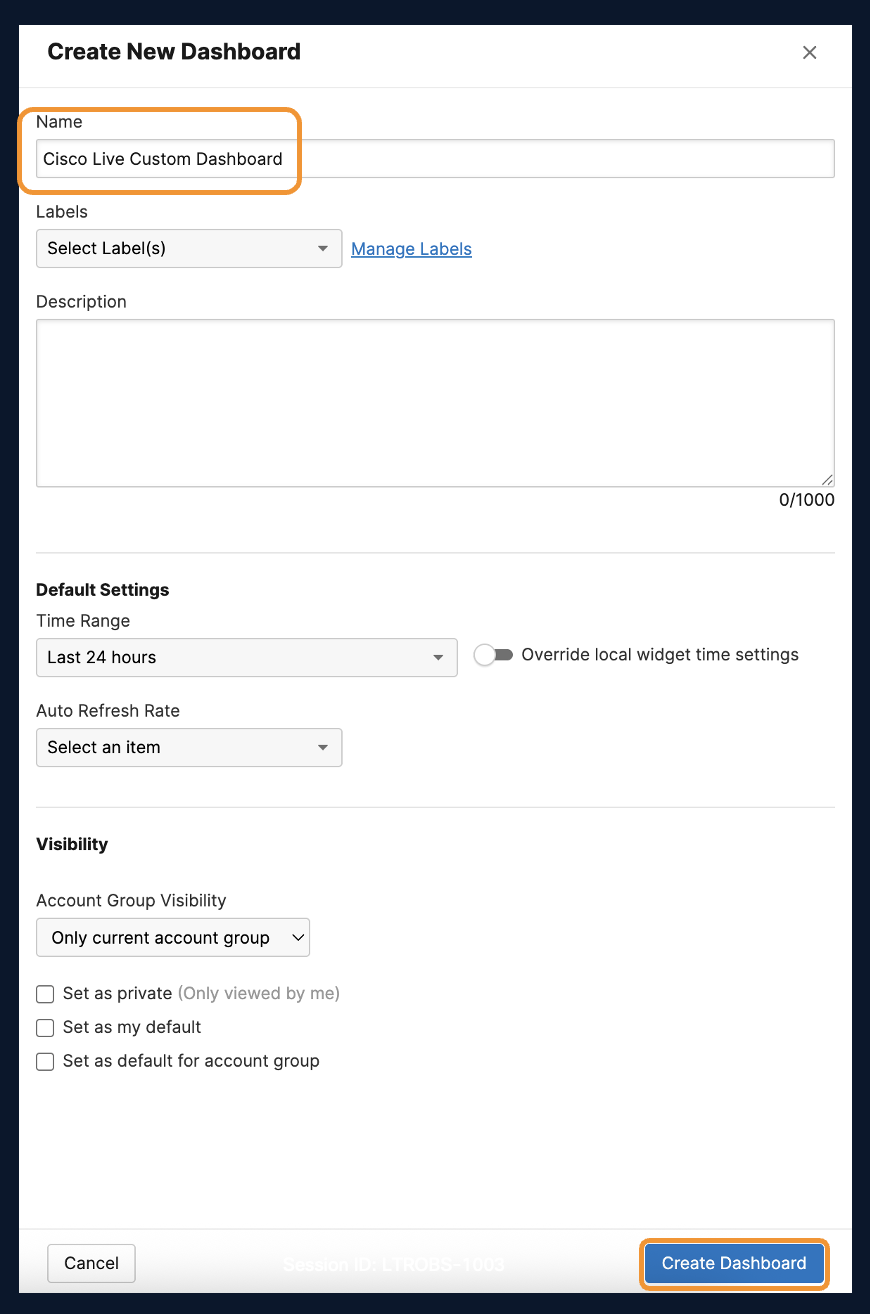
Start with a Blank Dashboard and name the Dashboard Cisco Live Custom Dashboard.
-
Once you have named your dashboard click Create Dashboard to start with a blank slate and start adding Widgets.
-
You should be redirected to the newly created Dashboard. Now its time to add widgets to finish the custom dashboard. In the top right-hand corner click on + New > Widget
In this task we are going to add 3 different widgets to display the data.
    a.  Add a Number Widget and Create 5 Cards
    b.  Add a Color Grid Widget
    c.  Add a Line Widget
Number Widget
Number Widgets are the most customizable widget for dashboards and can combine several different metrics from different parts of the platform. For this task, lets add Number Cards for the Teams Testing you created in Task 3. Here are snapshots to help create the first widget. Then you can go create the rest!
| Variable | Metric |
|---|---|
| Widget Title | Teams Availability Metrics |
| Data Source | Network & App Synthetics |
| Category | HTTP Server |
| Measure | Mean |
| Card Name | Teams Login |
| Test | Teams Login from Task 3 |
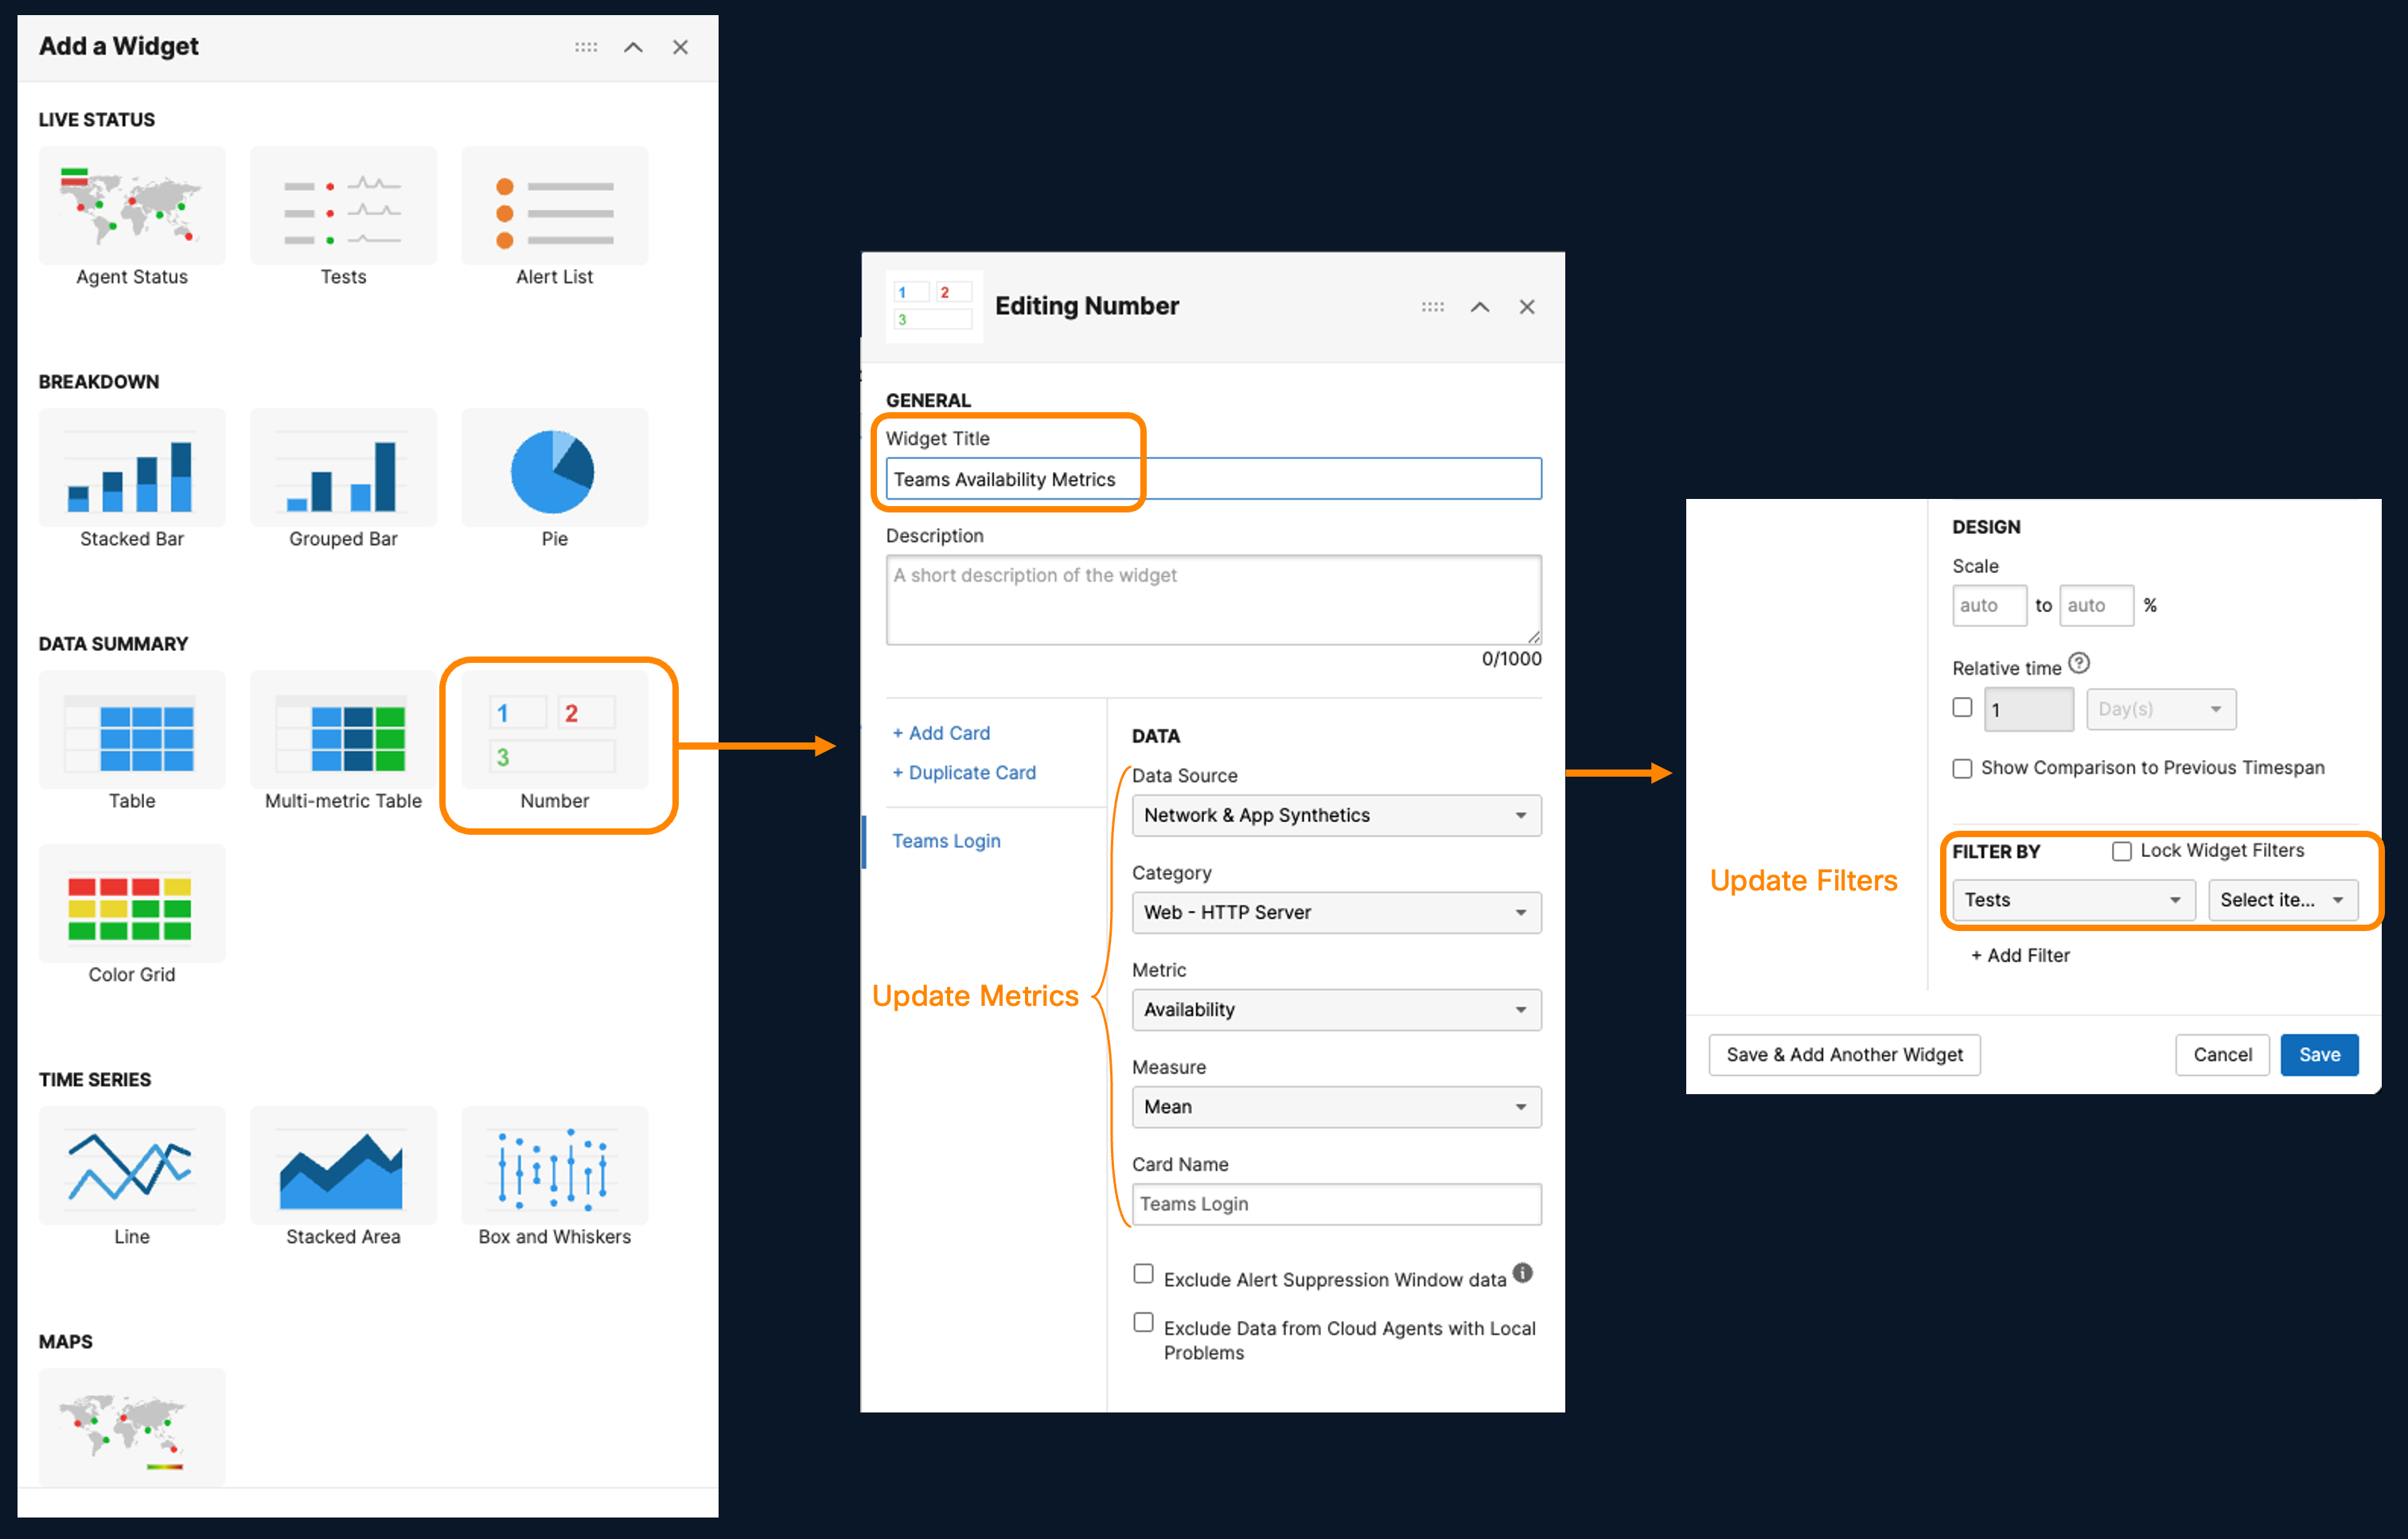
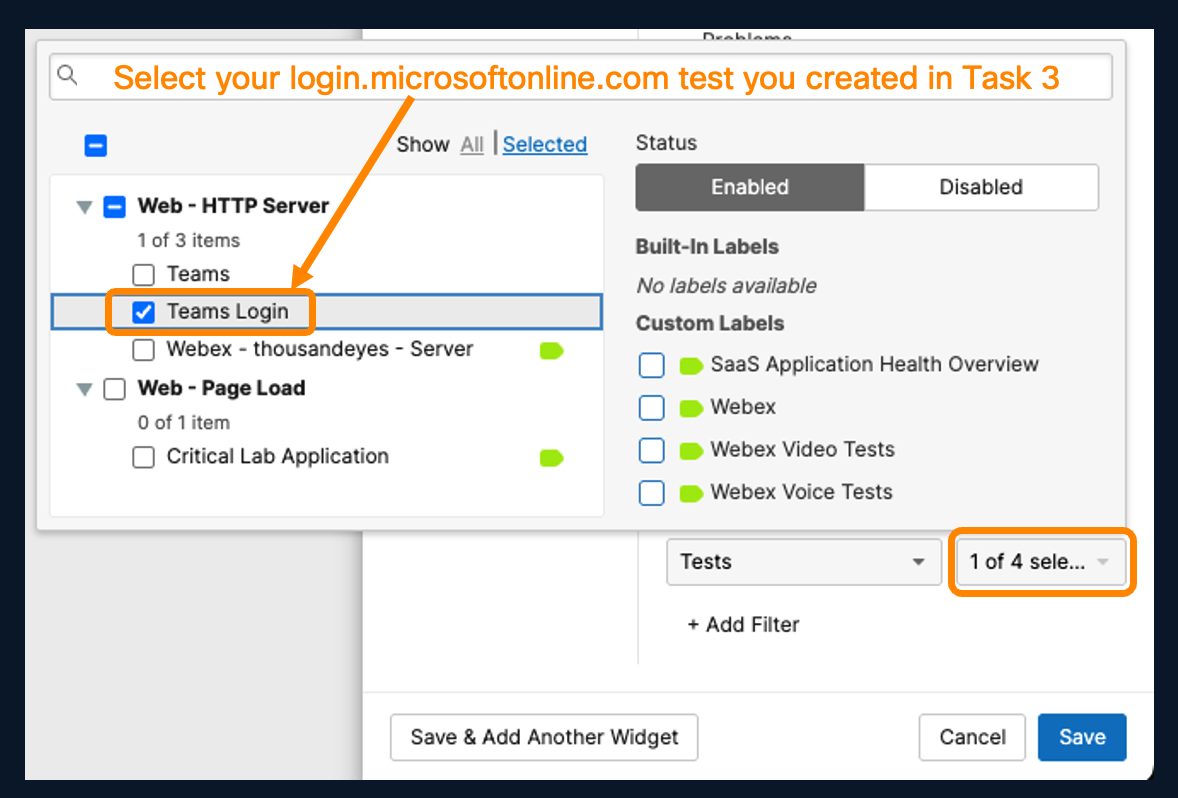
After you have selected the correct test, you need click back into the widget. To do that, click the white space in the widget to dismiss the test pop out window. You Click Add Card to add a new card. Repeat the steps with the variables below to create a fully custom widget.
b. Click + Add Card to add 2nd Card
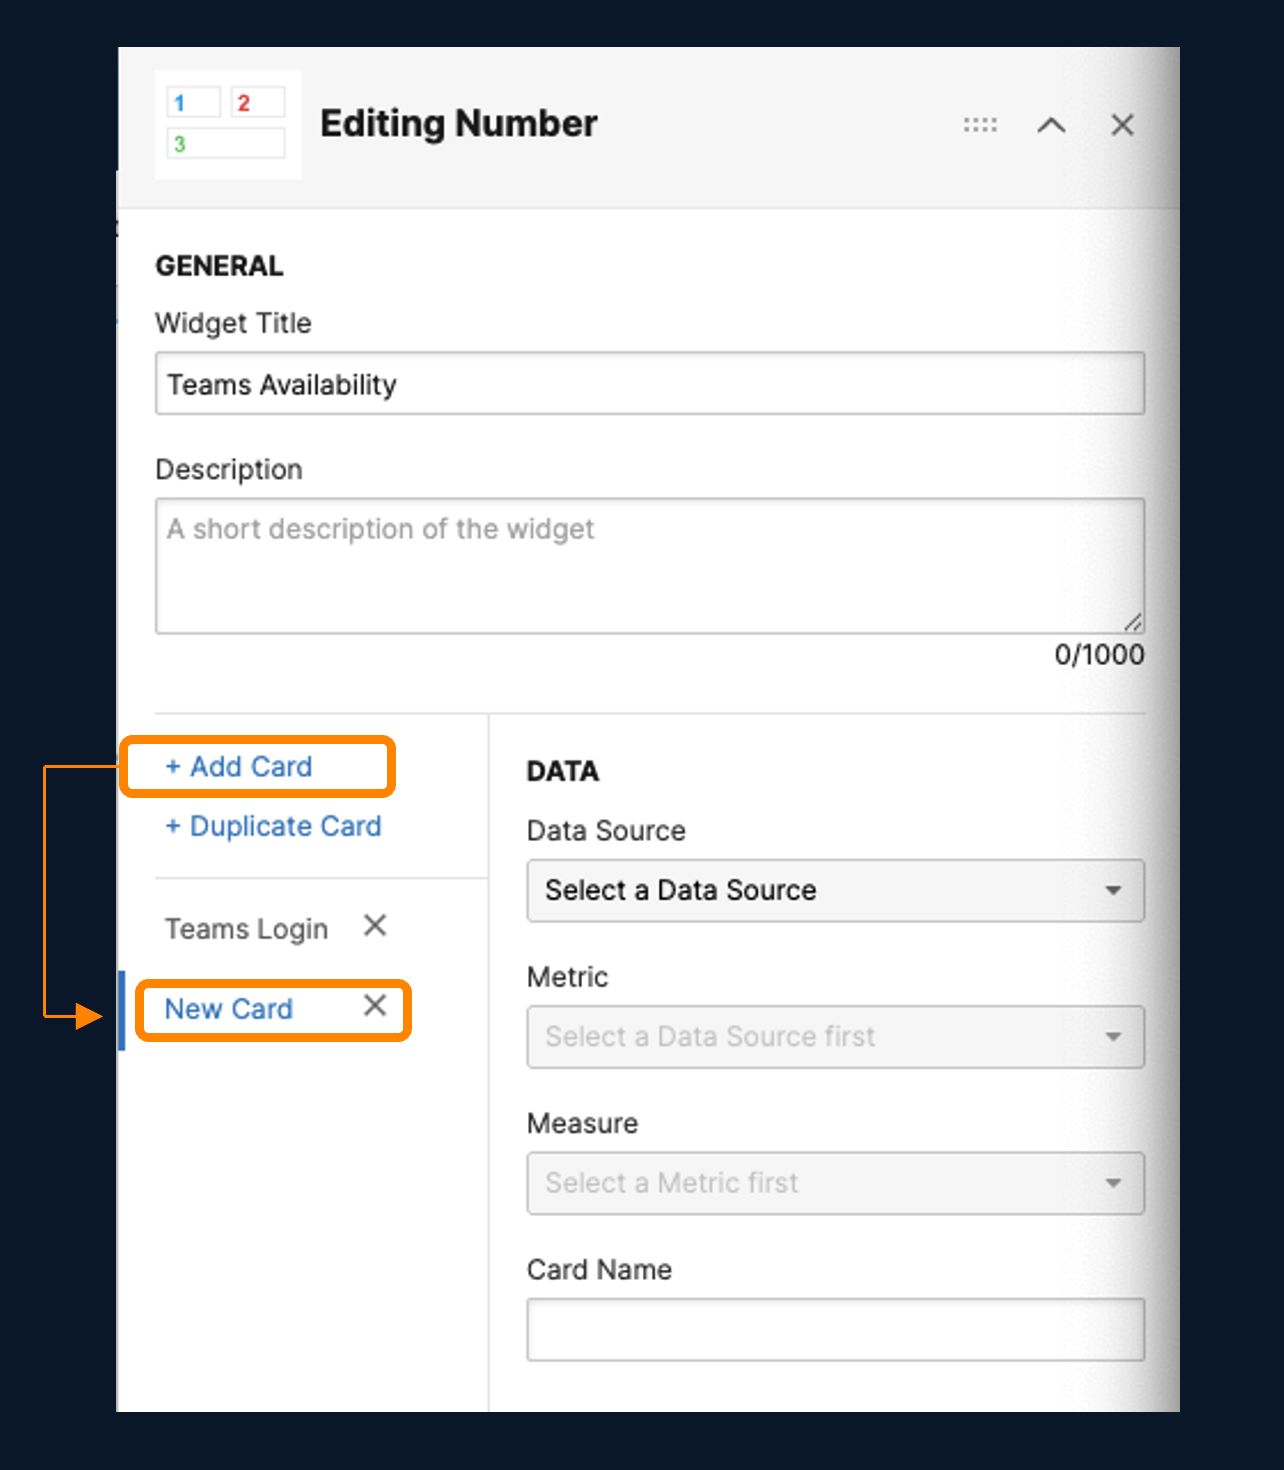
| Variable | Metric |
|---|---|
| Data Source | Network & App Synthetics |
| Category | Network - Agent to Server |
| Metric | Packet Loss |
| Measure | Mean |
| Card Name | Teams Audio/Video Loss |
| Test | Teams Transport Relay from Task 3 |
c. Click + Duplicate Card to add 3rd Card
| Variable | Metric |
|---|---|
| Metric | Latency |
| Card Name | Teams Audio/Video Latency |
d. Click *+ Duplicate Card* to add 4th Card
| Variable | Metric |
|---|---|
| Metric | Jitter |
| Card Name | Teams Audio/Video Jitter |
e. Click + Add Card to add the last card.
| Variable | Metric |
|---|---|
| Data Source | Network & App Synthetics |
| Category | Web - HTTP Server |
| Metric | Availability |
| Measure | Mean |
| Card Name | Teams Front Door |
| Test | teams.microsoft.com test from Task 3 |
-
If you were successful, your Number Widget should look like this. You can also navigate to the Cisco Live - LTROBS 1003 Account Group where you can see the fully deployed dashboard.

Color Grid Widget
Now that you have successfully added the Number Widget, lets make things a little easier. We are going to add the Color Grid widget.
-
Make sure you are in your newly created dashboard. In the top right-hand corner click on + New > Widget
-
Select the Color Grid Widget.
| Variable | Metric |
|---|---|
| Widget Title | All App Availability |
| Data Source | Network & App Synthetics |
| Category | Web - HTTP Server |
| Metric | Availability |
| Measure | Mean |
| Cards | Agents |
| Group Cards By | Tests |
| Sort By | Value |
| FILTER BY - Tests | Your Teams Testing created in Task 3 |
- Clone the Color Grid Widget you just created by selecting the gear icon and create a network loss color grid widget.
| Variable | Metric |
|---|---|
| Widget Title | All App Network Loss |
| Data Source | Network & App Synthetics |
| Category | Network - Agent to Server |
| Metric | Packet Loss |
| Measure | Mean |
| Cards | Agents |
| Group Cards By | Tests |
| Sort By | Value |
| FILTER BY - Tests | Your Teams Testing created in Task 3 |
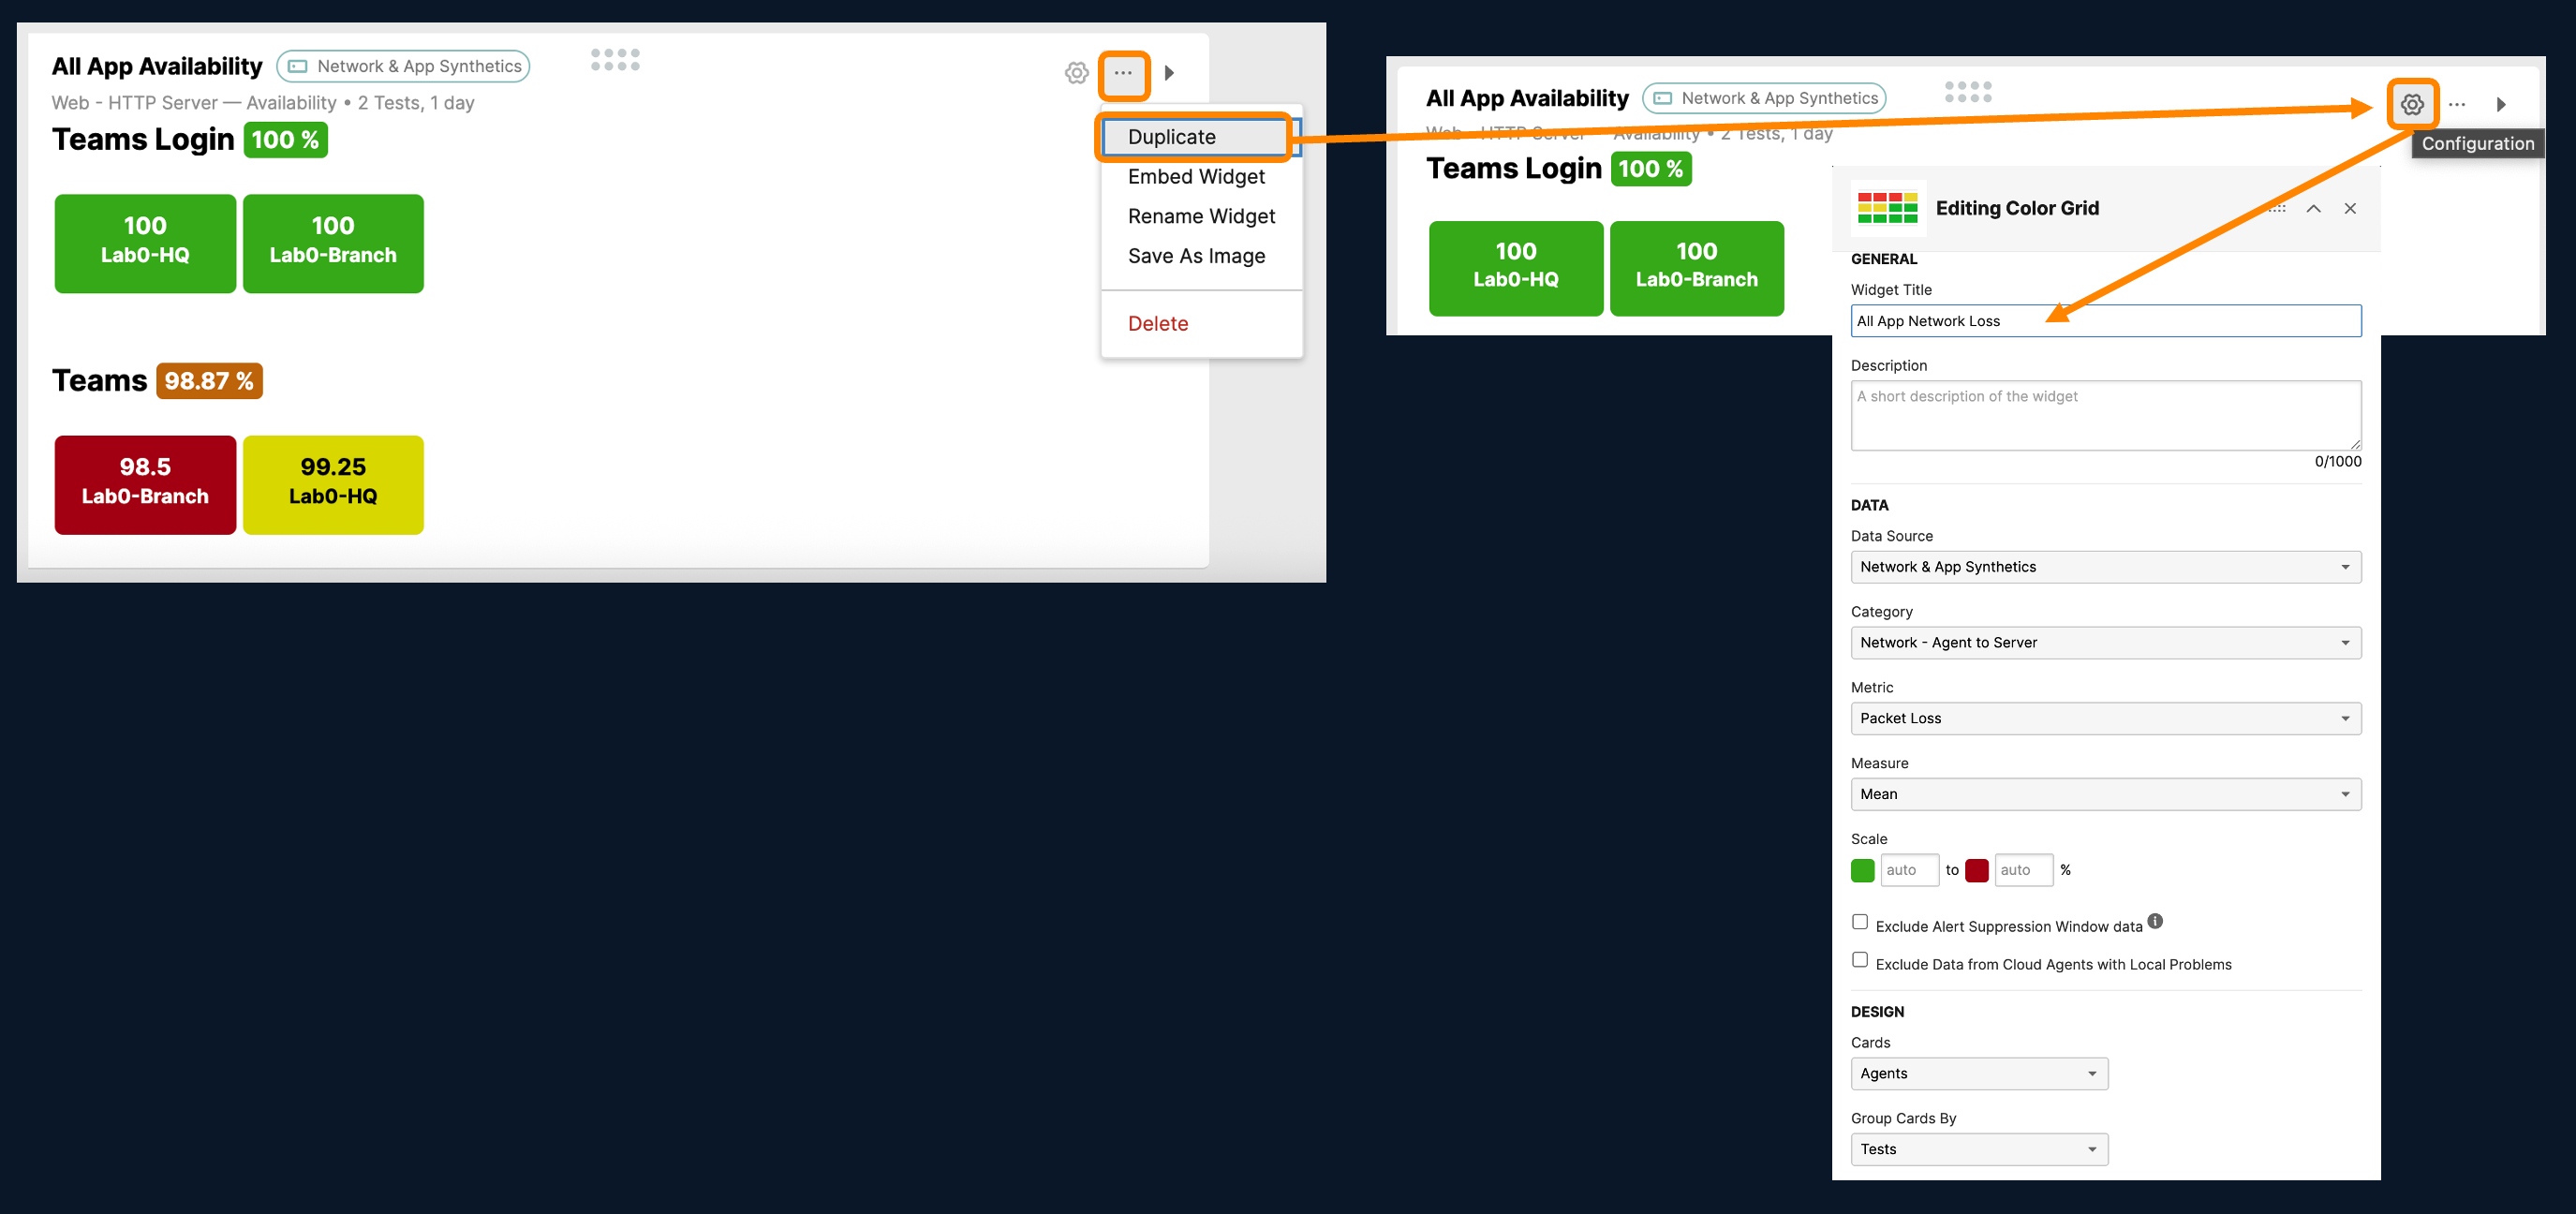
Line Widget
For the final step in the custom dashboard creation, lets look at line graphs by time
-
Make sure you are in your newly created dashboard. In the top right-hand corner click on + New > Widget
-
Select the Line Widget.
| Variable | Metric |
|---|---|
| Widget Title | Availability by Time |
| Data Source | Network & App Synthetics |
| Category | Network - Agent to Server |
| Metric | Packet Loss |
| Measure | Mean |
| Cards | Agents |
| Group Cards By | Tests |
| Sort By | Value |
| Filter By - Tests | Your Teams Testing created in Task 3 |
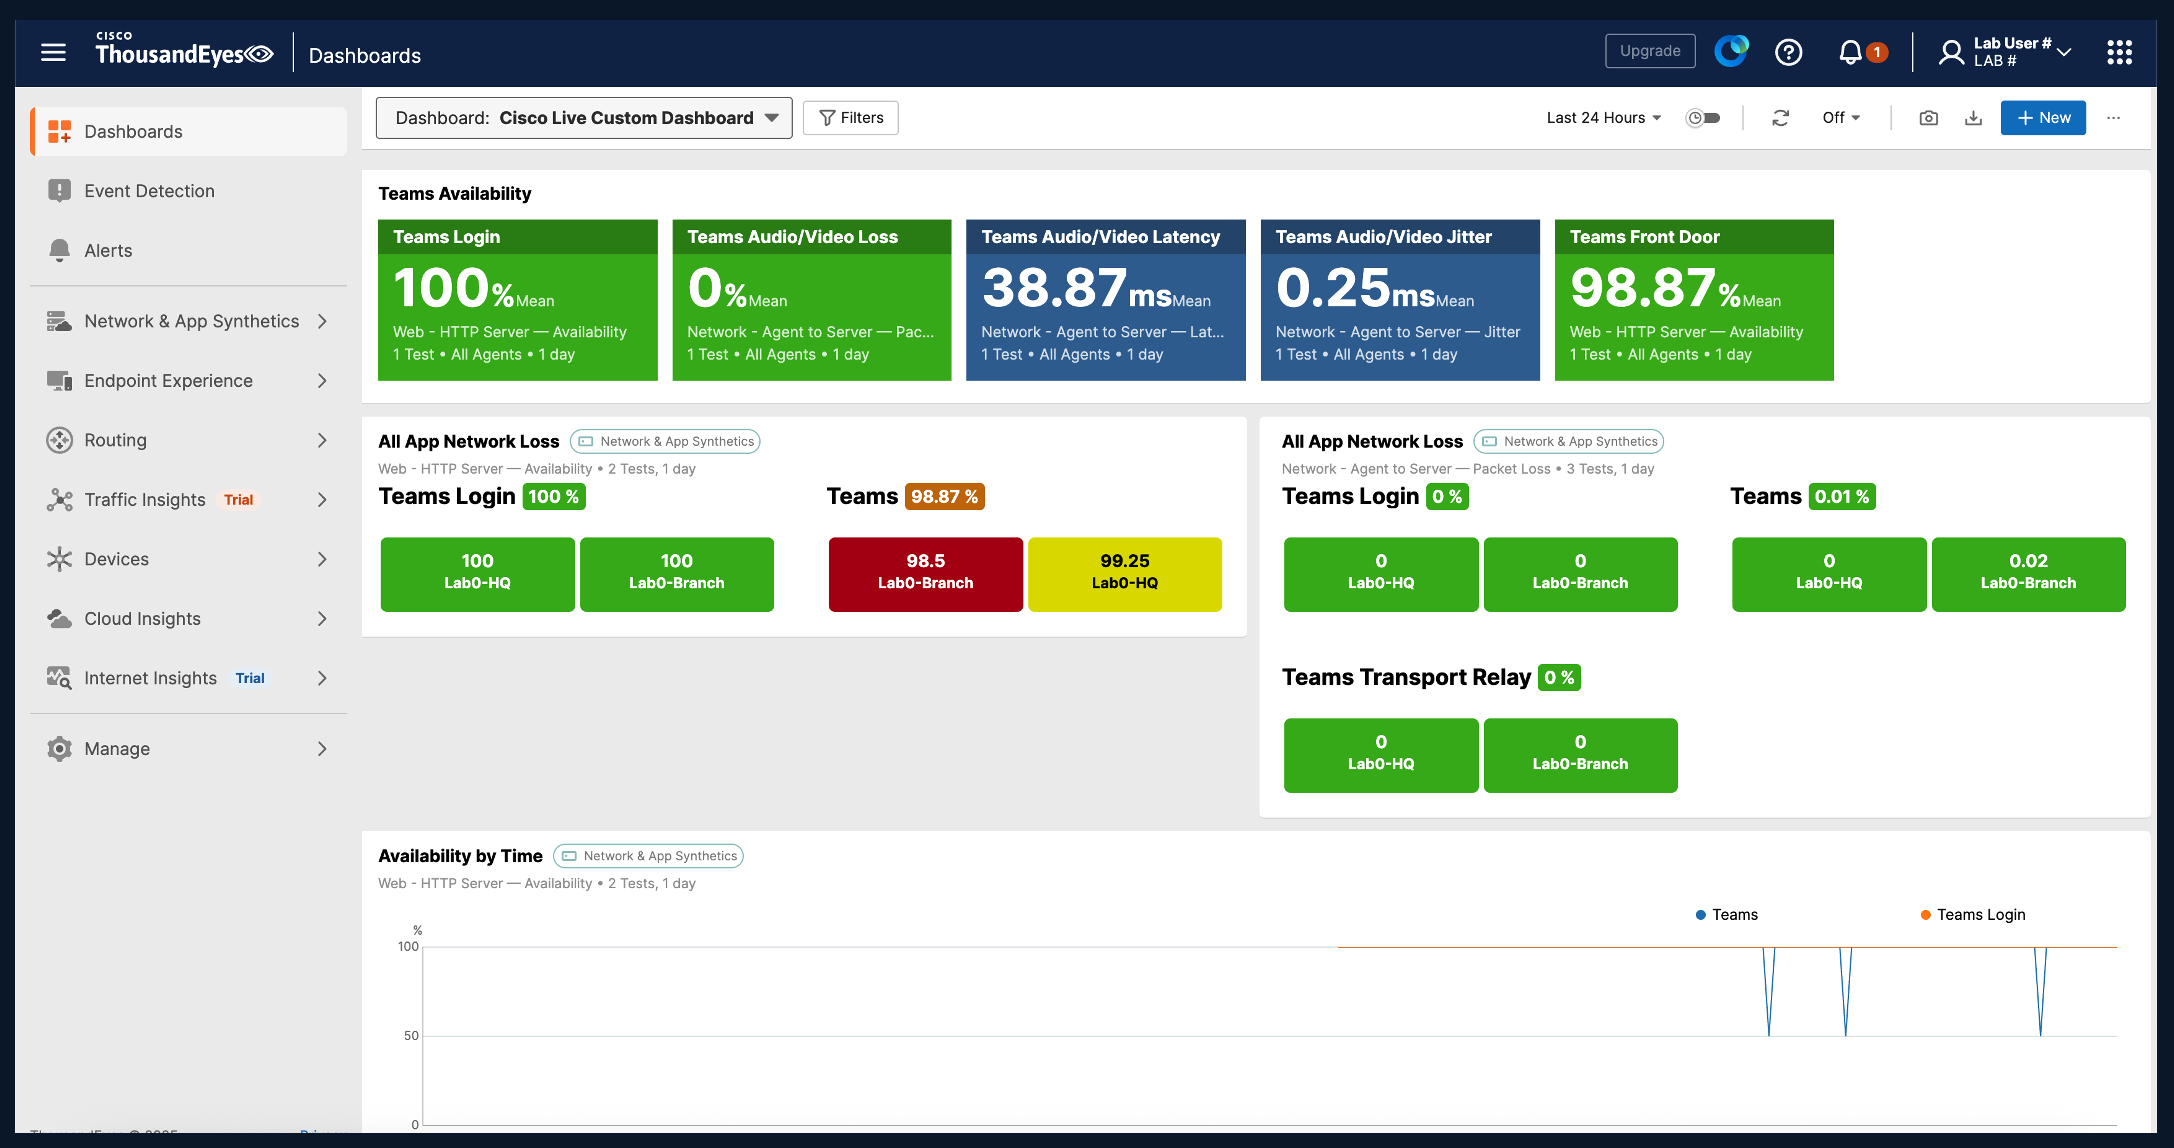
If you were successful your Custom Teams Dashboard should look something like this.
Dashboard Templates
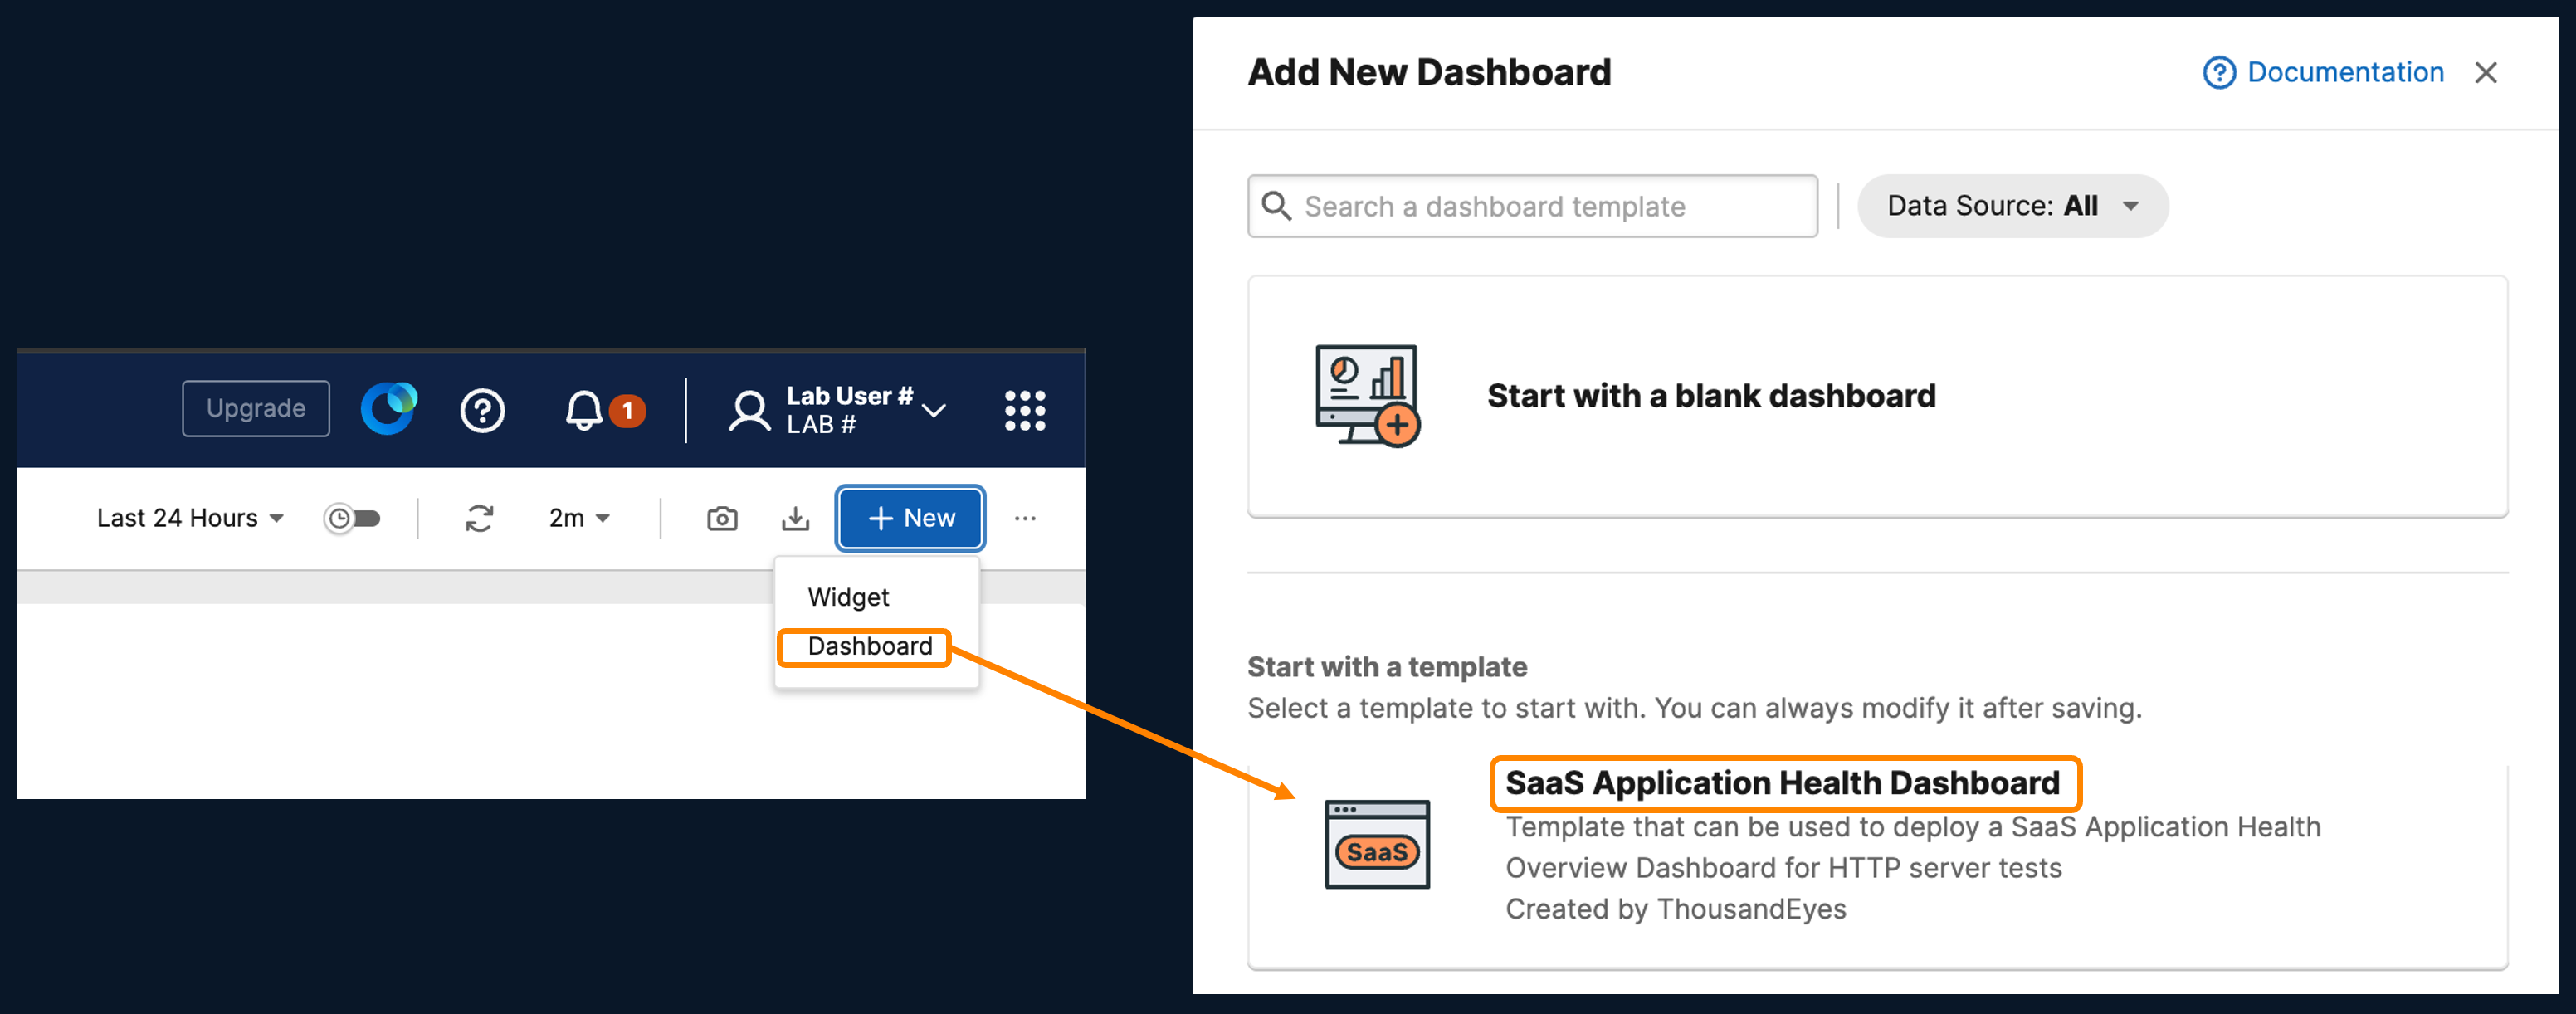
Your Application team still has that Critical Lab Application that needs to be monitored more closely. Your task is to go create a Custom Dashboard using a template.
- Navigate back to the Dashboards page. Click + New > Dashboard and scroll through the different types of templates. For this Application, create the SaaS Application Health Dashboard template.
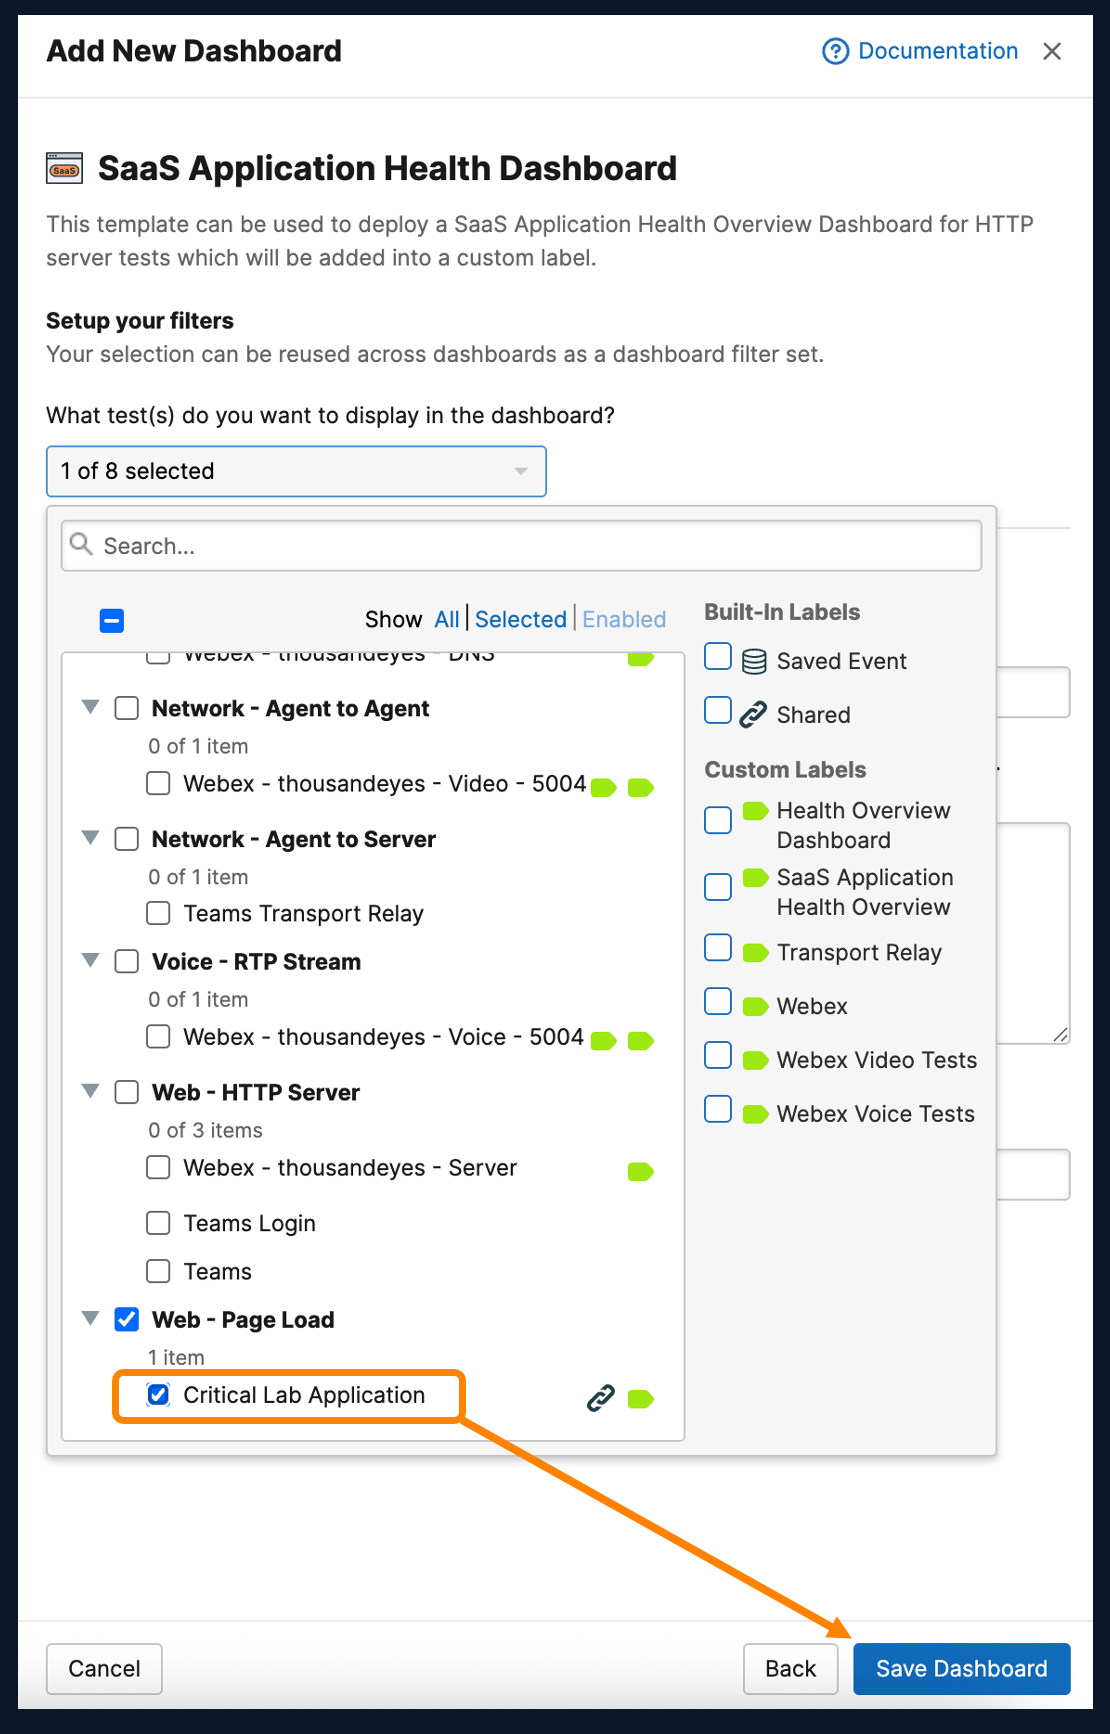
- Add the Critical Lab Application test and Click Save Dashboard.
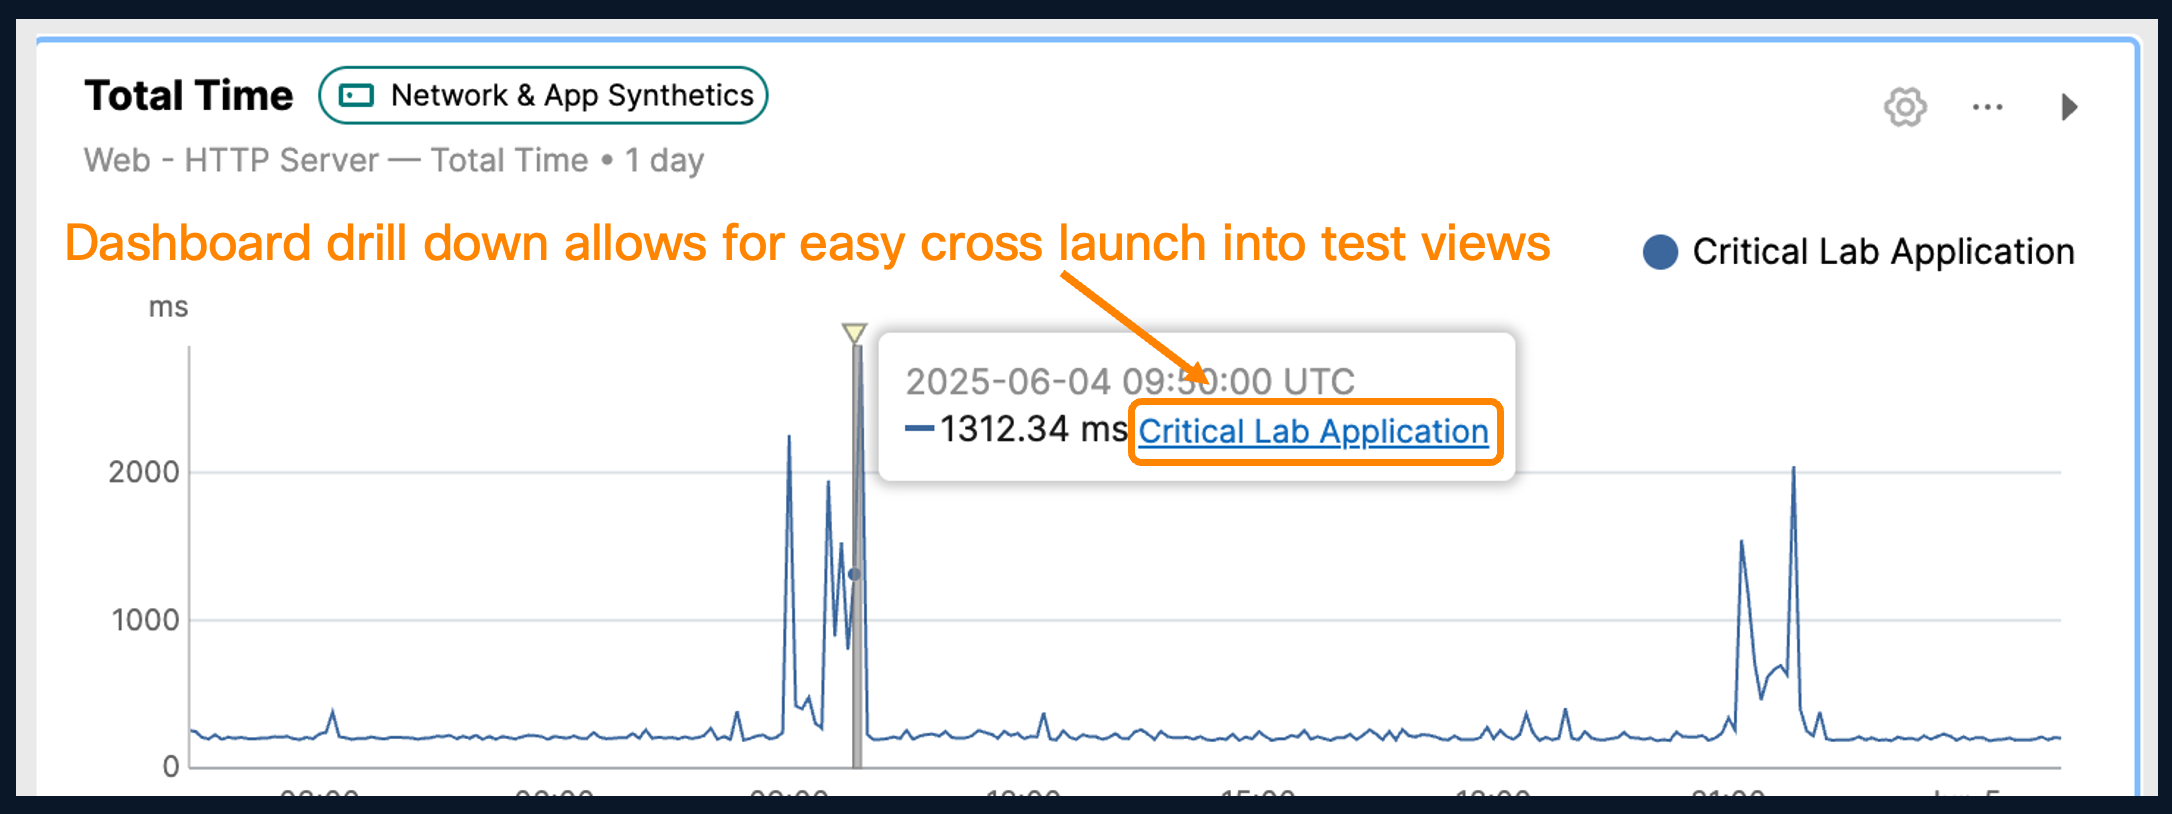
- Once the template is created, scroll through the dashboard to identify what layer the problem is happening at. Mouse over the problem area in the graph and you can Drill Down into the test view to further investigate if needed.
You have successfully completed Task 6!!