Task 4 - Last Mile Assurance - End User Monitoring

Step 1: Stay in your Lab Account Group
- Make sure you are still in your lab Account Group. LAB 1 - 30
Step 2: Download and Install Endpoint Agent
-
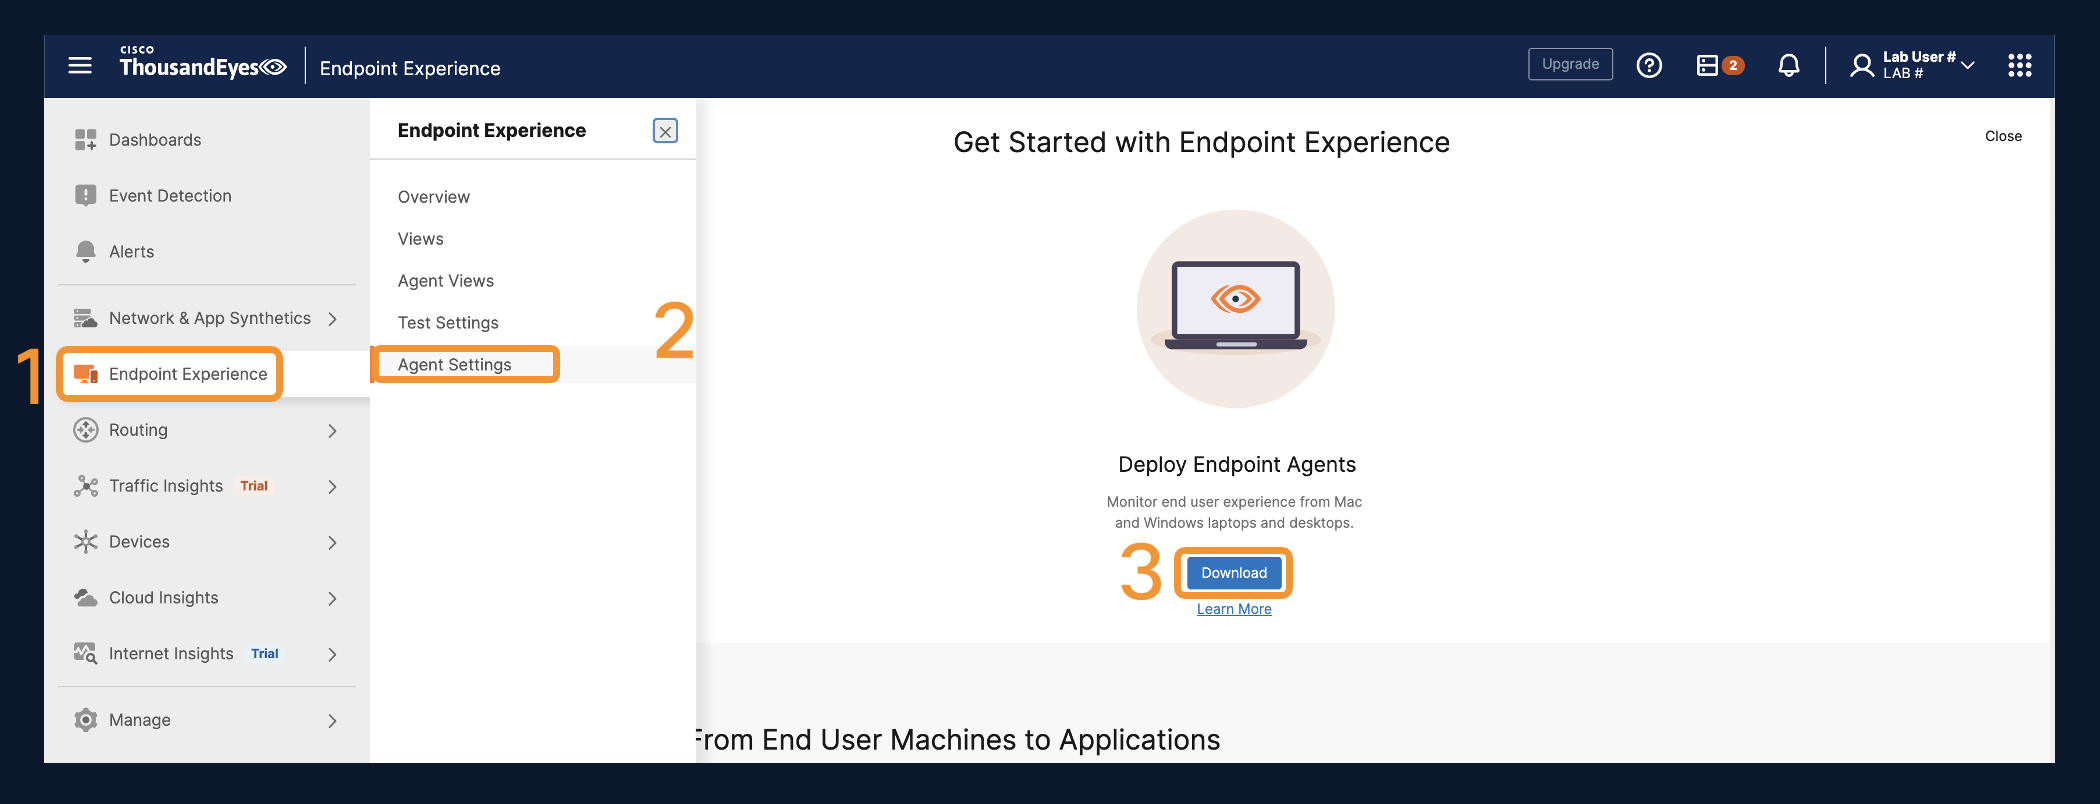
Navigate to Endpoint Experience > Agent Settings > Download. You will get a Pop Out window.
-
Download the x64 Endpoint MSI
-
Copy the Connection String on the download page.
-
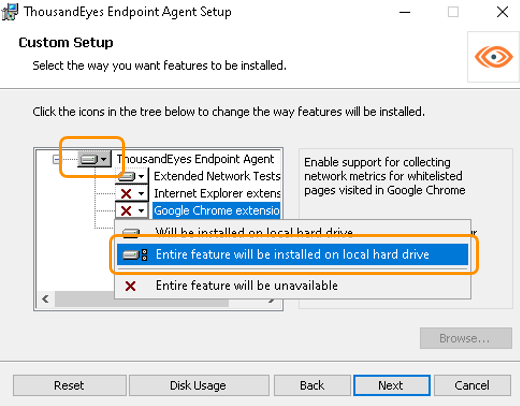
Launch the Installer and be sure to turn on the entire feature sets for Extended Network Tests and the Browser Extension installed on your endpoint.
-
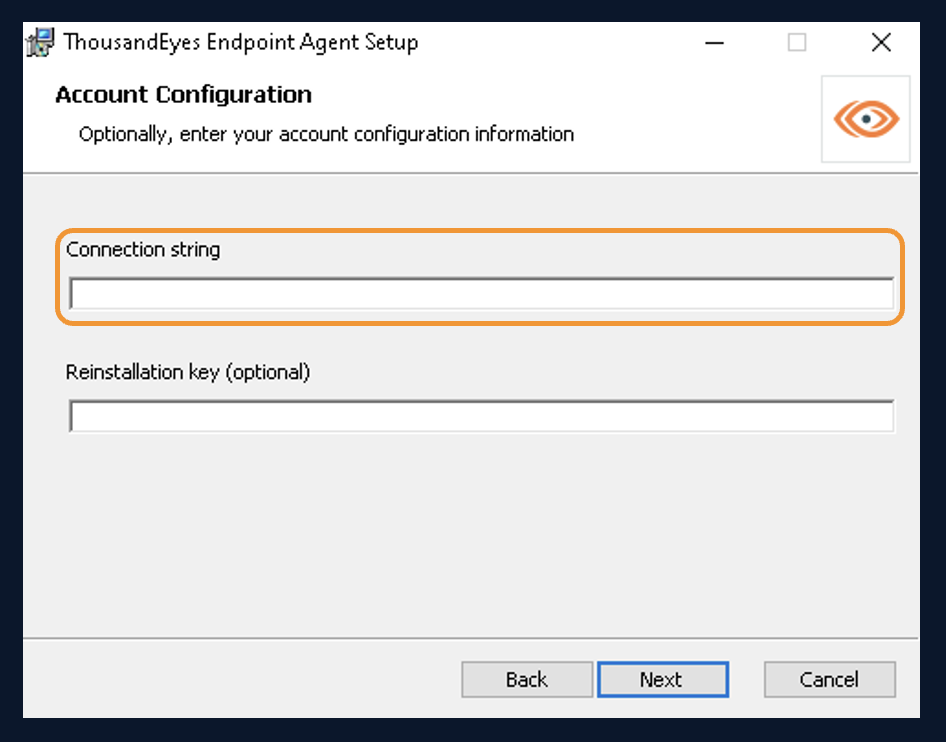
Add the Connection String from your account when prompted. This is how the endpoint is associated with the correct account.
-
Once the installer is complete. Verify the Endpoint is checking into ThousandEyes successfully. This may take up to 5 minutes.
Step 3: Deploy Microsoft Teams Template
The ThousandEyes Endpoint Agent sits between the users eyes and the keyboard. ThousandEyes collaboration visibility is enhanced by advanced algorithms detecting real time calls and meetings with Teams, Webex and Zoom at the time of this session.
Use Templates to create additional Teams tests from the workstations under Endpoint Experience > Test Settings > Monitor Application.
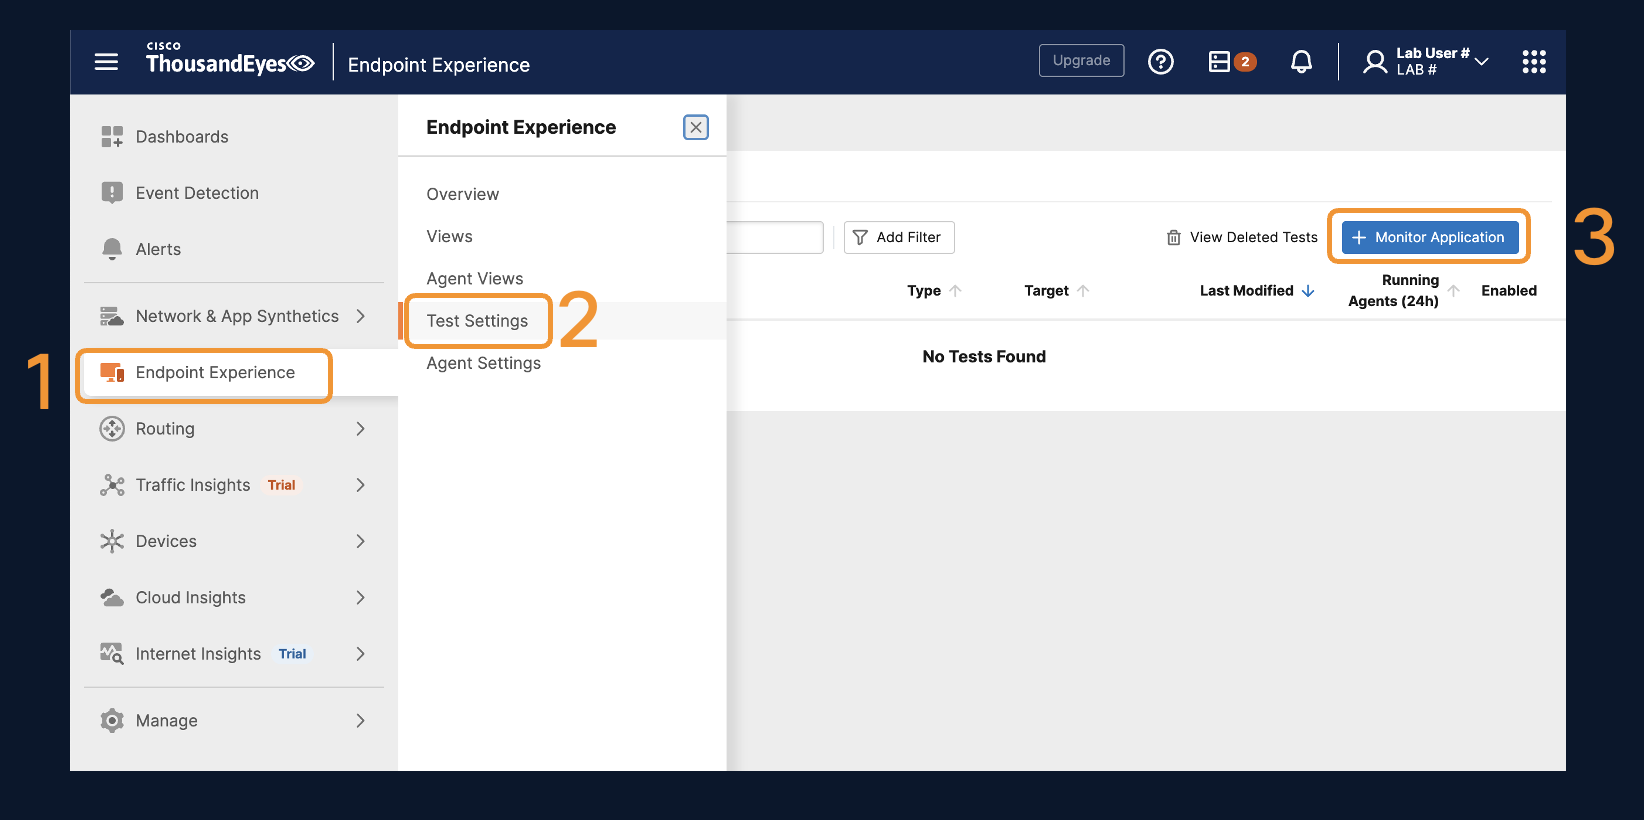
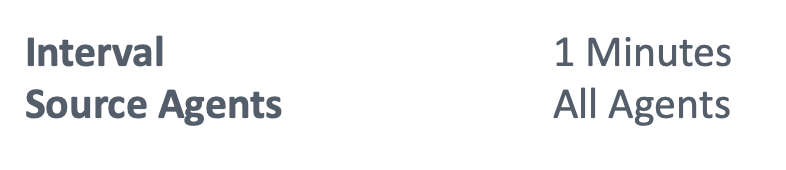
- Use the Microsoft Teams template to create a front door test to Microsoft Teams. Take notice of the tests and their destinations.
Note: HTTP Server Testing includes the Network Layer Testing in a top-down approach of the OSI model. Network Layer testing does not include HTTP Server Web Layer Testing.
Step 4: Deploy Webex Template
Unlike the Cloud and Enterprise Agent testing, using the Teams. Webex, and Zoom Templates for Endpoint Agents will create a Dynamic Test that detects when a Teams, Webex or Zoom Meeting is taking place, directly testing to the Media Servers that each collaboration service uses to forward the voice and video feeds. ThousandEyes Dynamic Testing automatically discovers which transport relay server the workstation connects to, taking the guesswork out of the network.
-
Navigate to Endpoint Experience > Test Settings > Monitor Application
-
Launch the Webex Template and apply the following configurations.
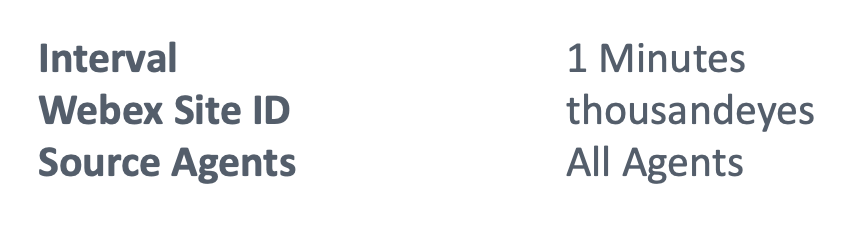
- Navigate through and verify the correct tests are being created by selecting the Webex - HTTP Server and Webex - Dynamic test under Global Settings at the top left.
Step 5: Join Webex Meeting
-
Once the test is created, join a Webex meeting from the Webex Desktop Application.
-
If the Webex Application is not already downloaded, download this before launching the meeting. Do not join the meeting from the Web Client.
-
Join this Webex meeting - https://thousandeyes-sbx.webex.com/meet/CiscoLive
Step 6: Analyze The Data
-
After joining the Webex from the desktop client you should start to see data come in Views under the Webex Dynamic Test.
-
Navigate to Endpoint Experience > Views > Dynamic Tests.
-
Verify your endpoint is collecting data on the meeting you just launched.
-
Identify the Webex Data Center you joined.
a. Mouse Over the teal destination nodes on the far-right hand side of path visualization. You should see the destination IP Address and Location.
Step 7: Applying the Knowledge
Hybrid Work is here to stay. A seamless user experience end user experience whether in the office, at home, or at a coffee shop is paramount. The first application most users notice connectivity issues with are real time applications like the collaboration applications just configured.
Scenario
You recently received a ticket that a user is experiencing call drops on a Webex. You were given this interactive snapshot to troubleshoot: Webex Meeting.
-
Click on the Webex Meeting interactive snapshot to begin. In the graph, you immediately see a lot of red indicating end-to-end network loss.
-
You want to further check the connection to rule out workstation connectivity issues. You notice the user is on a wireless connection.
What is the Wireless Network Name (SSID), Wireless Signal Strength and Noise levels at the time of the call degradation?
Click to Reveal Answer
    SSID = hurricane_5G
    Signal Strength = -38dBm
    Noise = -89dBm
< /details>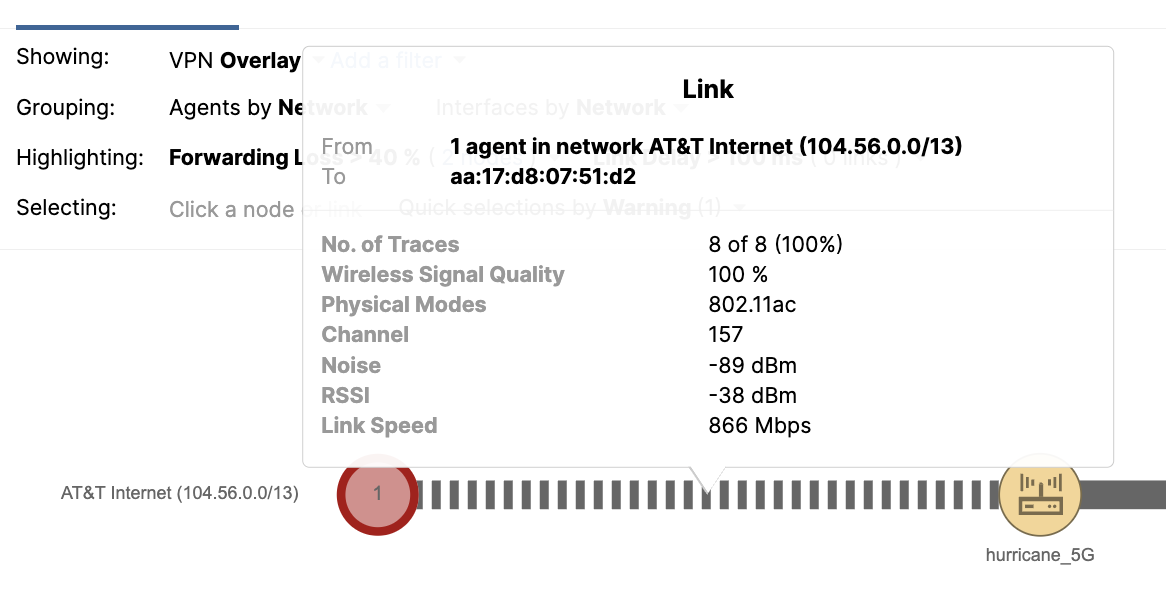
-
You want to further understand if this is only affecting the collaboration services or everything. You select Scheduled Tests.
What is the destination of the scheduled test? Does the output align with the Dynamic Test for Webex?
Click to Reveal Answer
Destination - 8.8.8.8 Yes, the output aligns. You see that the the loss pattern matches exactly. If you were to look at the path trace below, you would notice the same pattern of loss. -
During your investigation, you navigate to the path trace or hop-by-hop full service delivery path below to find where the loss is occurring.
What hops or nodes are seeing the loss in the Webex Dynamic Test?
Click to Reveal Answer
    Hops 172.16.5.1 and 192.168.1.1

    You know the user is working remote based on the wireless connection and unknown network.

You detect that the loss is occurring inside the remote network. -
What is the root cause of the disruption?
a.  Webex is experiencing an outage.

b.  The local network is experiencing a service outage.

c.  DNS is wrongly configured.

d.  The wireless signal is extremely low and it's a local connection issue to wireless.
Click to Reveal Answer
b.  The local network is experiencing a service outage.

This is very clear when looking at the loss pattern.  The network path continually fails
at the default gateway and local home network.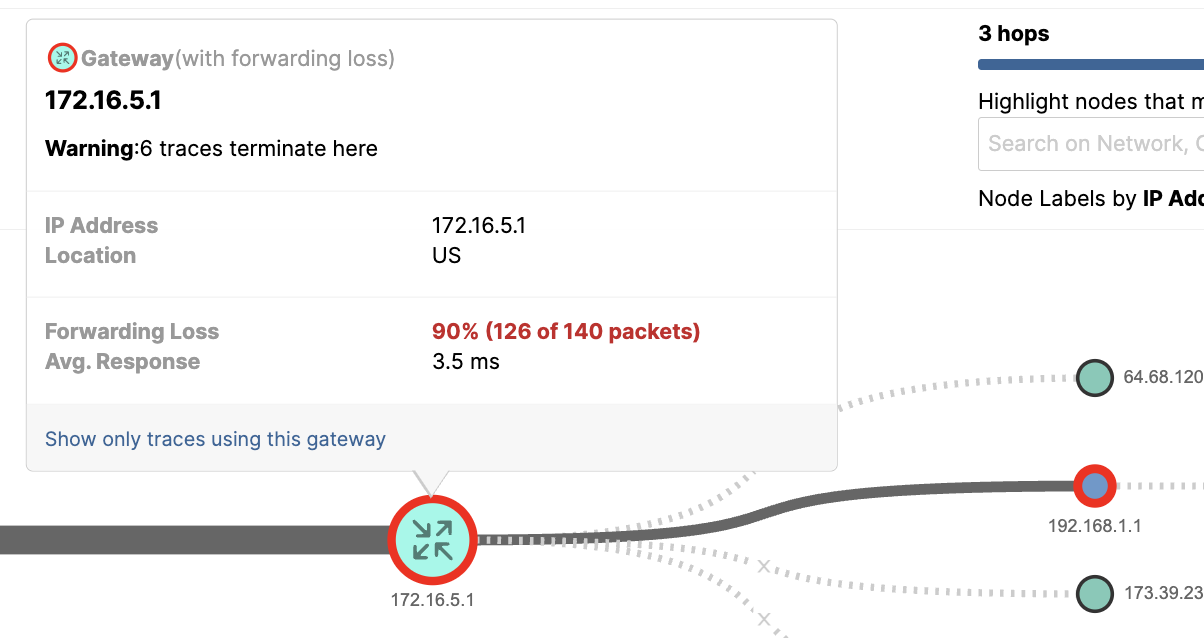
You have successfully completed Task 4!!